Open Access
Fig. 5
Download original image
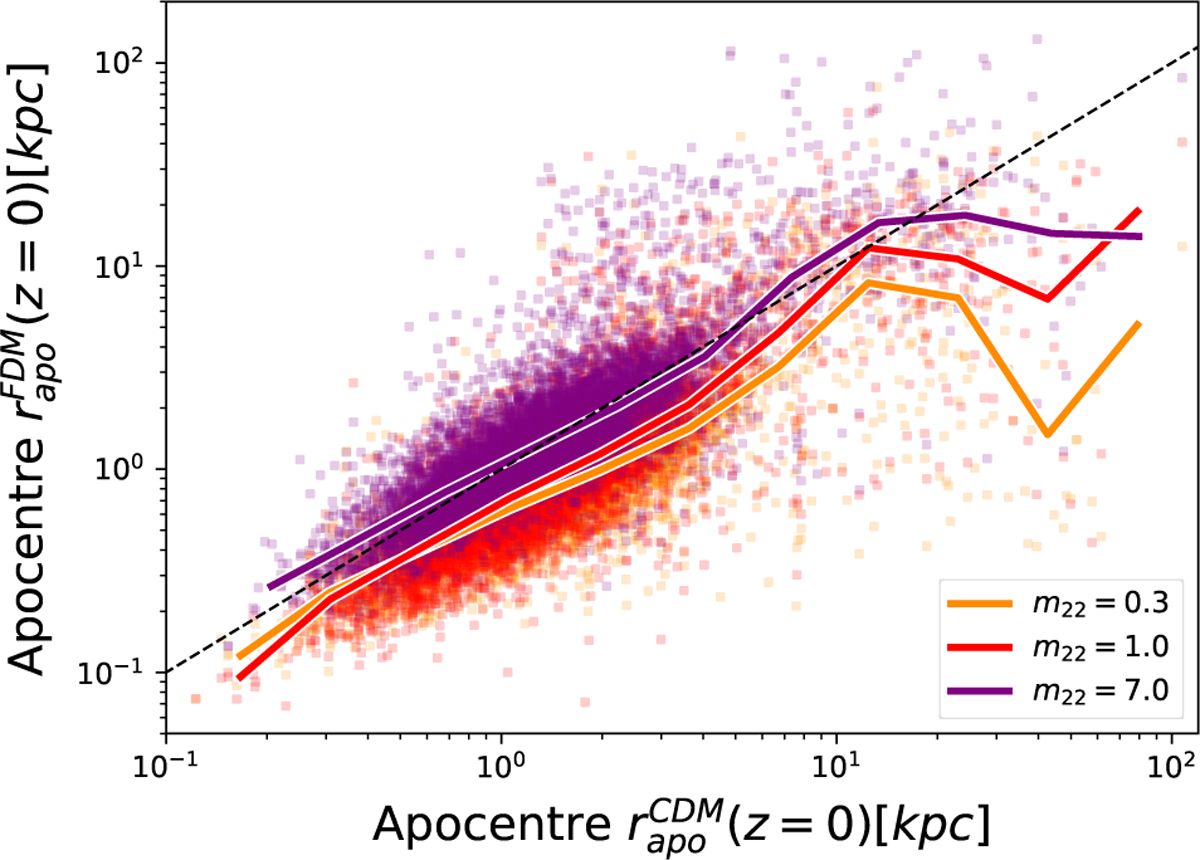
Last apocenter in FDM as a function of the last apocenter in CDM for in situ GCs across our entire MW sample for different DM models. The three colors represent different FDM models, with m22 = 0.3 (orange), 1.0 (red), and 7.0 (violet). The lines indicate the median values.
Current usage metrics show cumulative count of Article Views (full-text article views including HTML views, PDF and ePub downloads, according to the available data) and Abstracts Views on Vision4Press platform.
Data correspond to usage on the plateform after 2015. The current usage metrics is available 48-96 hours after online publication and is updated daily on week days.
Initial download of the metrics may take a while.