Open Access
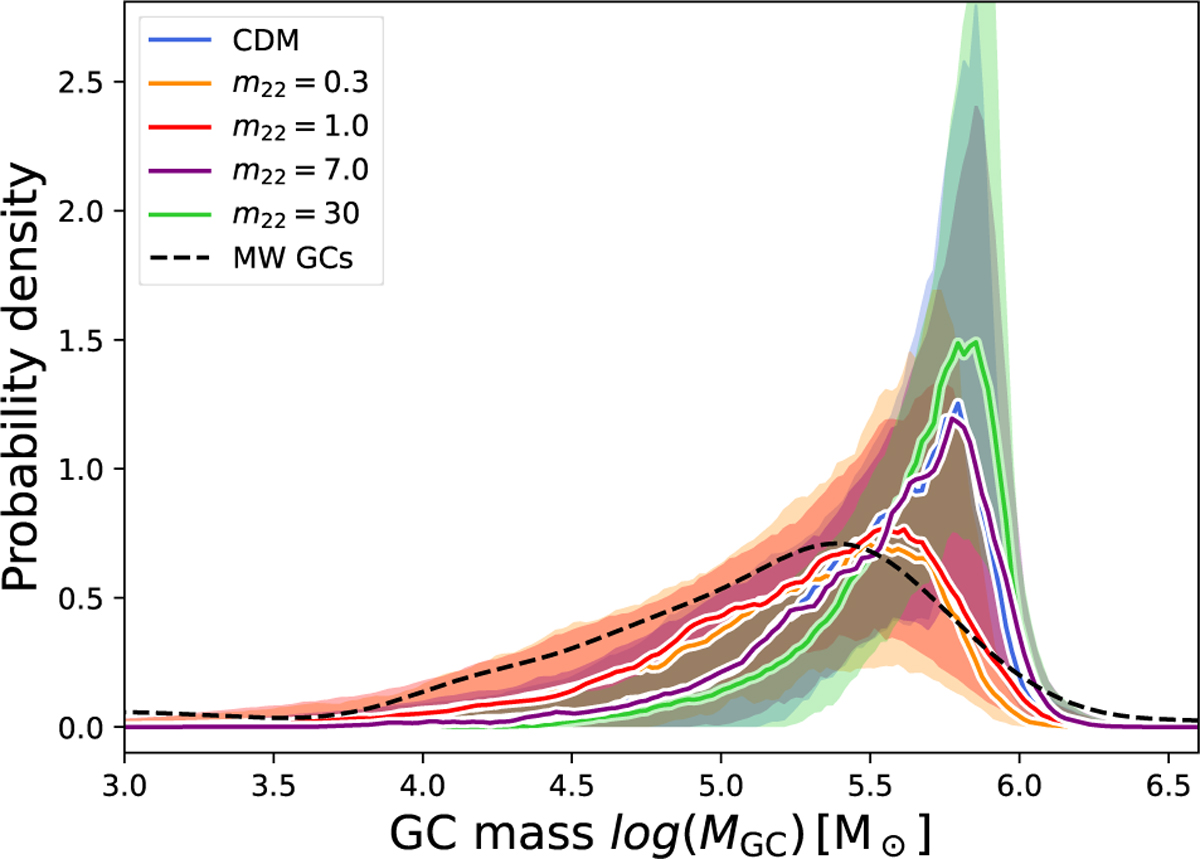
Fig. 6
Download original image
Probability density of GC mass at z = 0 for different DM models. Solid lines show the median trends, with shaded regions indicating the 25th and 75th percentiles. The black dashed line corresponds to the observed GC population in the MW, although it includes both in situ and ex situ clusters.
Current usage metrics show cumulative count of Article Views (full-text article views including HTML views, PDF and ePub downloads, according to the available data) and Abstracts Views on Vision4Press platform.
Data correspond to usage on the plateform after 2015. The current usage metrics is available 48-96 hours after online publication and is updated daily on week days.
Initial download of the metrics may take a while.