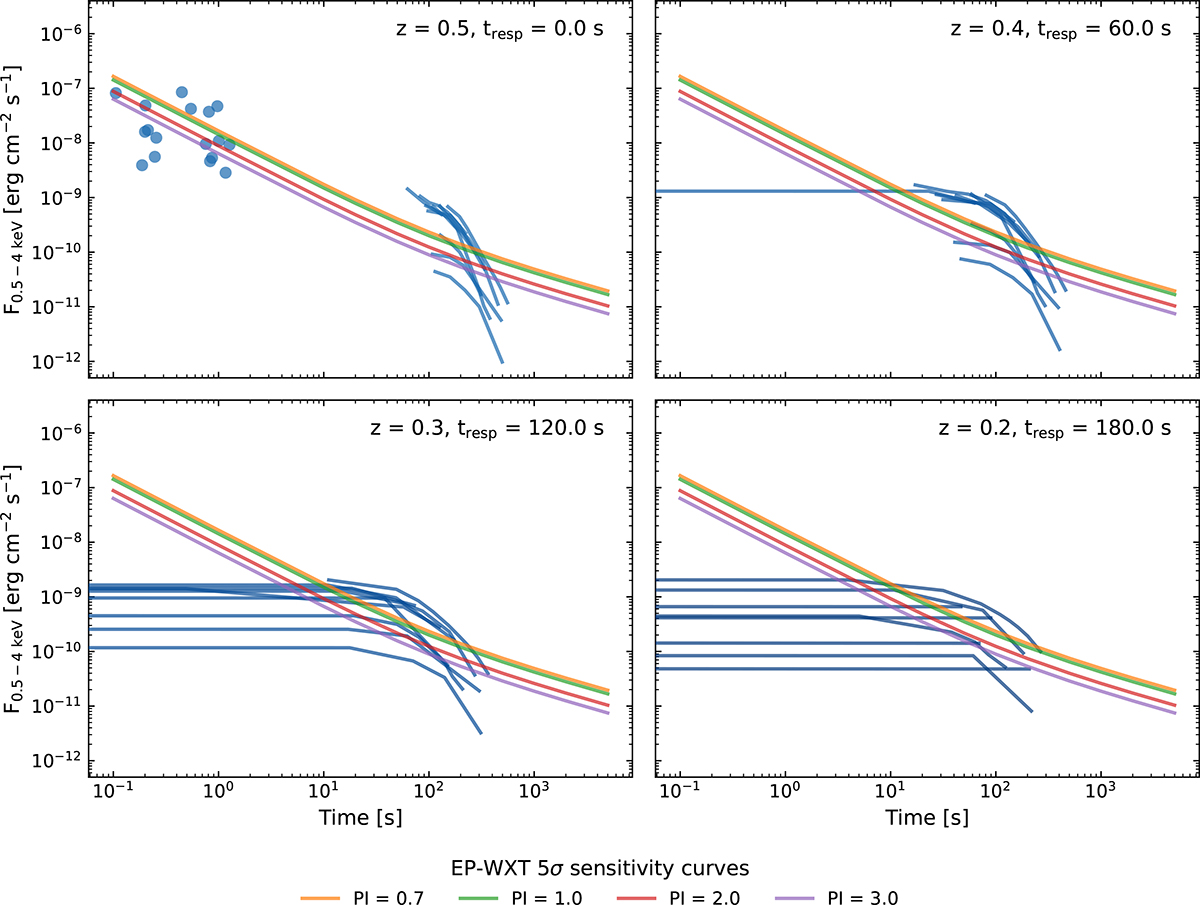
Fig. F.2.
Download original image
Detectability of the early X-ray emission of short GRBs with EP-WXT in pointing mode. Each panel shows the absorbed flux in the EP-WXT energy band as a function of the time after the repointing. That is, time zero on the x-axis corresponds to the response time, which is the time interval from the GRB trigger, including the time required to transmit and receive the alert and to slew the instrument to the target. The response time and the redshift of the sources are indicated in the top right corner of each panel. Blue dots represent the prompt emission flux, while blue curves represent the steep decay emission flux. The colored curves are the 5σ sensitivity curves of EP-WXT, computed for different photon indices in the EP-WXT energy band.
Current usage metrics show cumulative count of Article Views (full-text article views including HTML views, PDF and ePub downloads, according to the available data) and Abstracts Views on Vision4Press platform.
Data correspond to usage on the plateform after 2015. The current usage metrics is available 48-96 hours after online publication and is updated daily on week days.
Initial download of the metrics may take a while.