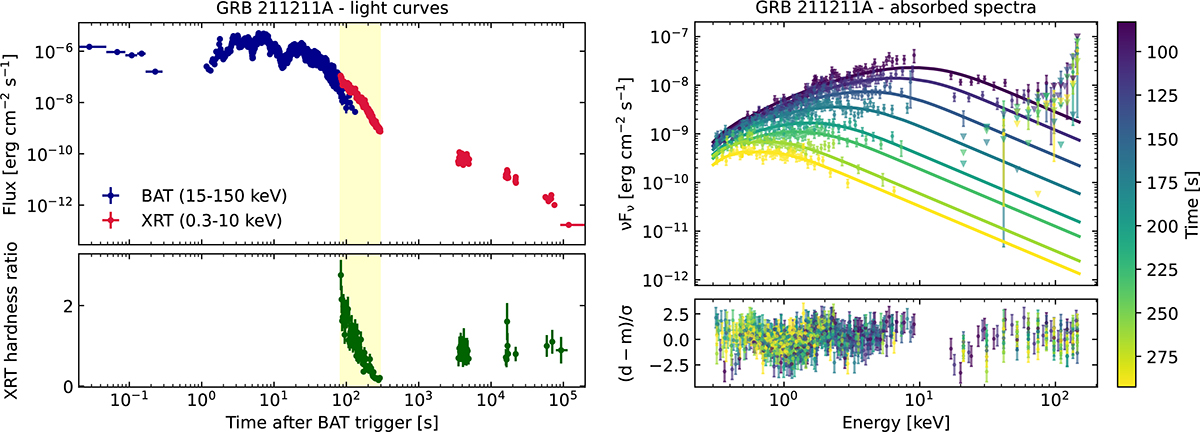
Fig. 2.
Download original image
X-ray light curve (left) and time-resolved spectral evolution (right) of GRB 211211A. The left panel shows the XRT and BAT observations selected to analyze the early X-ray emission of GRB 211211A. In the upper panel, the blue and red data points represent, respectively, the BAT and XRT light curves. In the lower panel, the XRT hardness ratio is shown in green. The yellow shaded area highlights the time interval selected for the spectral analysis. The right panel displays the evolution of the absorbed spectrum of GRB 211211A in νFν representation. The color scale indicates the different time bins. Data points from XRT and BAT are shown as dots, with triangles indicating upper limits. The solid curves represent our best-fit model. Residuals are displayed in the lower panel.
Current usage metrics show cumulative count of Article Views (full-text article views including HTML views, PDF and ePub downloads, according to the available data) and Abstracts Views on Vision4Press platform.
Data correspond to usage on the plateform after 2015. The current usage metrics is available 48-96 hours after online publication and is updated daily on week days.
Initial download of the metrics may take a while.