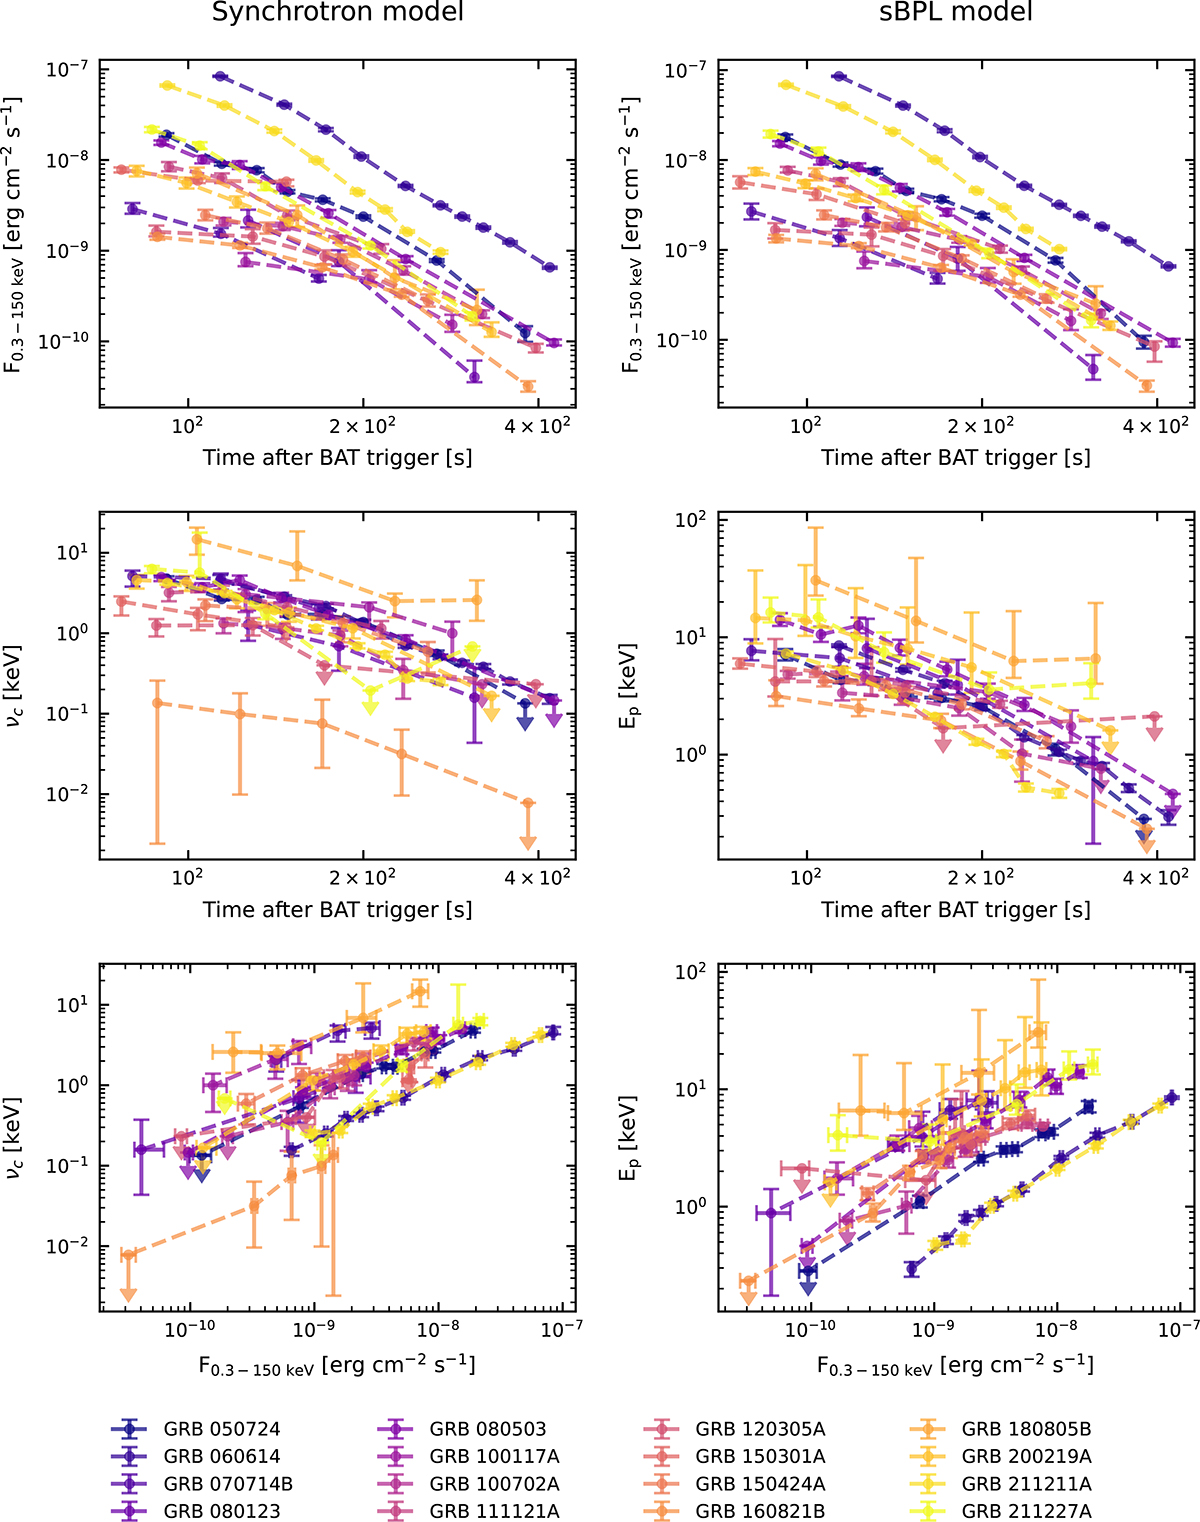
Fig. 3.
Download original image
Left column: Evolution of the flux in 0.3−150 keV energy band (top), evolution of νc (middle), and νc as a function of F0.3 − 150 keV (bottom), assuming a synchrotron spectral model. Right column: Evolution of the flux in 0.3−150 keV energy band (top), evolution of Ep (middle), and Ep as a function of F0.3 − 150 keV (bottom), assuming a sBPL spectral model. Each color refers to a different GRB. Error bars represent 1σ uncertainties, while arrows represent 68% upper limits.
Current usage metrics show cumulative count of Article Views (full-text article views including HTML views, PDF and ePub downloads, according to the available data) and Abstracts Views on Vision4Press platform.
Data correspond to usage on the plateform after 2015. The current usage metrics is available 48-96 hours after online publication and is updated daily on week days.
Initial download of the metrics may take a while.