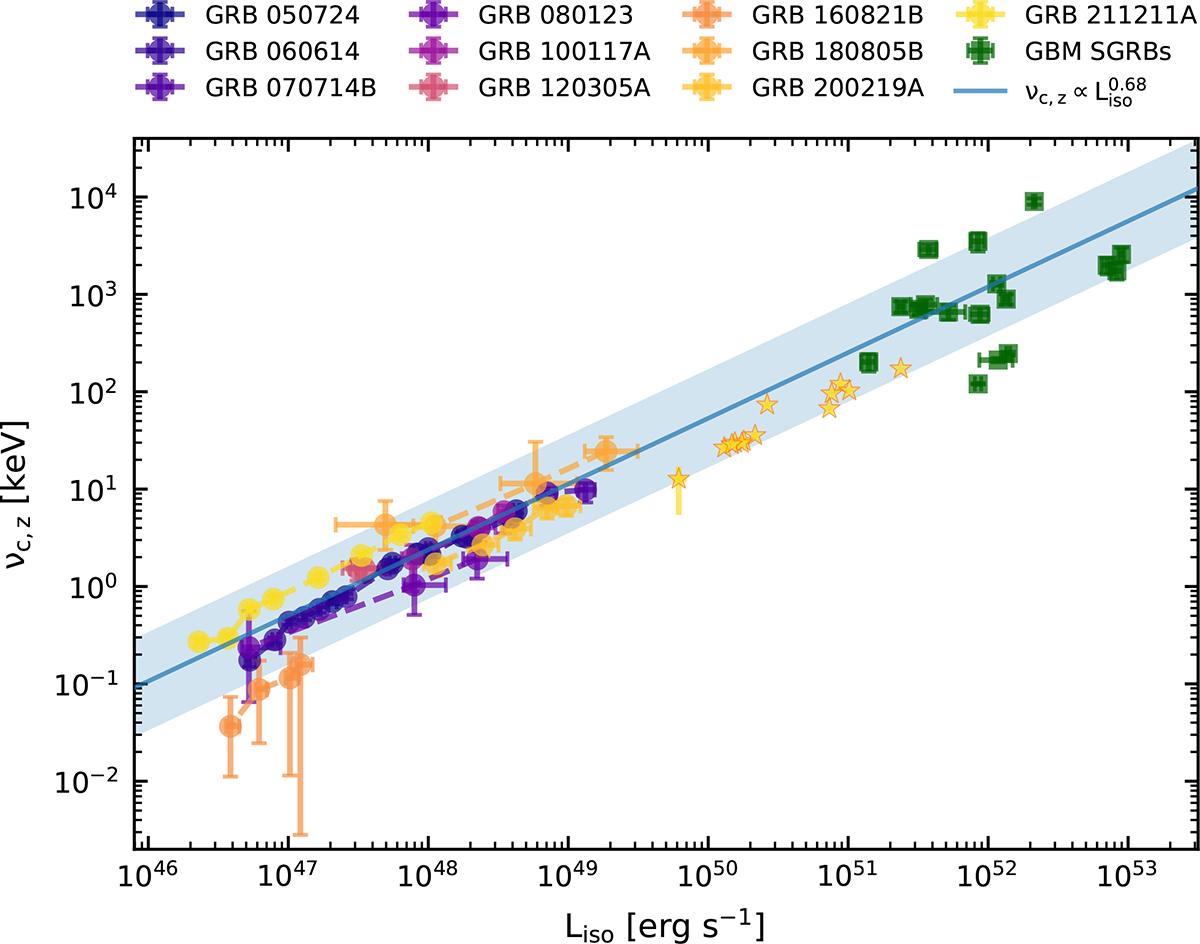
Fig. 4.
Download original image
Relation between νc, z and Liso fit with the X-ray data of the bursts in our sample, represented by colored circles. The straight blue line represents the best-fit line from the linear fit, while the blue-shaded area shows the 3σsc scatter region of the relation. The relation has been extrapolated to higher energies, where GBM short GRB data are represented with green squares. GRB 211211A data are taken from Mei et al. (2025) and are represented with yellow stars.
Current usage metrics show cumulative count of Article Views (full-text article views including HTML views, PDF and ePub downloads, according to the available data) and Abstracts Views on Vision4Press platform.
Data correspond to usage on the plateform after 2015. The current usage metrics is available 48-96 hours after online publication and is updated daily on week days.
Initial download of the metrics may take a while.