Fig. 1
Download original image
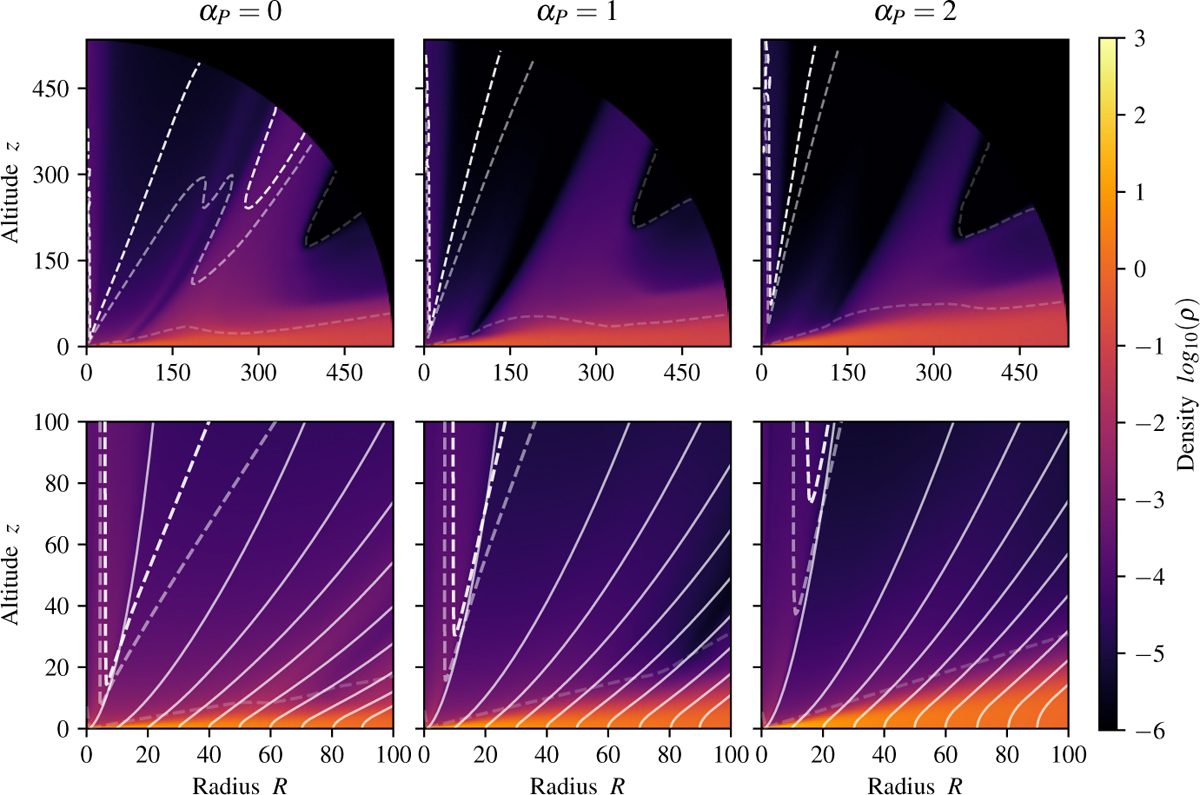
Two-dimensional visualizations at t = 1000 for simulations with αP = 0, 1, and 2, from left to right. The top panels display the full computational domain, while the bottom panels show a zoomed-in view of the inner region. Dashed lines, with increasing opacity, represent the slow magnetosonic (SM), Alfvén, and fast magnetosonic (FM) critical surfaces, respectively. White lines indicate magnetic-field lines anchored at R = 2, 10, 20, 30, and up to 90. The background color map shows the density in arbitrary units.
Current usage metrics show cumulative count of Article Views (full-text article views including HTML views, PDF and ePub downloads, according to the available data) and Abstracts Views on Vision4Press platform.
Data correspond to usage on the plateform after 2015. The current usage metrics is available 48-96 hours after online publication and is updated daily on week days.
Initial download of the metrics may take a while.