Fig. C.3
Download original image
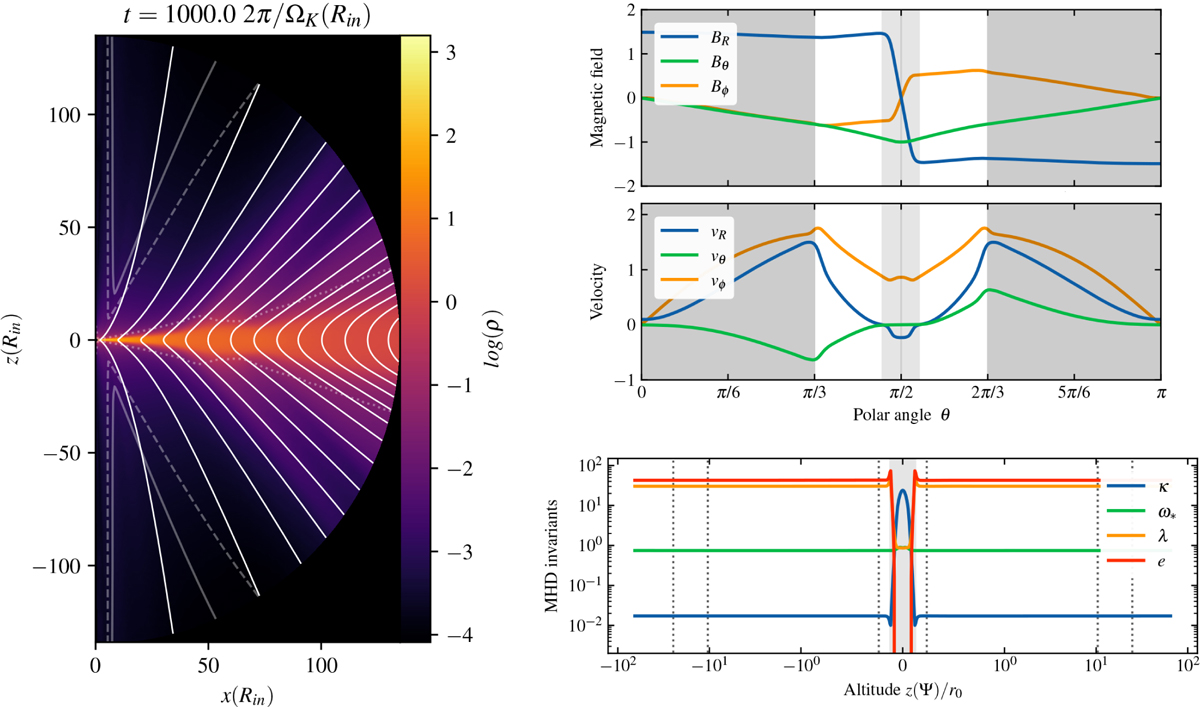
Left: 2D visualization at t = 1000 for the simulation performed over the interval [0, π]. Dashed lines, with increasing opacity, represent the slow magnetosonic (SM), Alfvén, and fast magnetosonic (FM) critical surfaces, respectively. White lines indicate magnetic field lines anchored at R = 2, 10, 20, 30, up to 130. The background colormap shows the density in arbitrary units. Upper right: Latitudinal profiles of the magnetic field components BR, Bθ, Bϕ (normalized to Bz at the disk midplane), and components of the velocity vR, vθ, vϕ (normalized to the Keplerian velocity vK at the disk midplane), measured at R = 2.0 and t = 1000. The central gray-shaded region corresponds to the disk, the white region to the disk wind, and the outer gray-shaded regions to the spine. Lower right: Profiles of the four MHD invariants κ, ω*, λ, e along the magnetic field line anchored at R = 2.0, measured at t = 1000. The shaded area indicates the resistive MHD region, while the vertical dashed lines mark the positions of the SM, A, and FM critical surfaces.
Current usage metrics show cumulative count of Article Views (full-text article views including HTML views, PDF and ePub downloads, according to the available data) and Abstracts Views on Vision4Press platform.
Data correspond to usage on the plateform after 2015. The current usage metrics is available 48-96 hours after online publication and is updated daily on week days.
Initial download of the metrics may take a while.