Open Access
Fig. 10
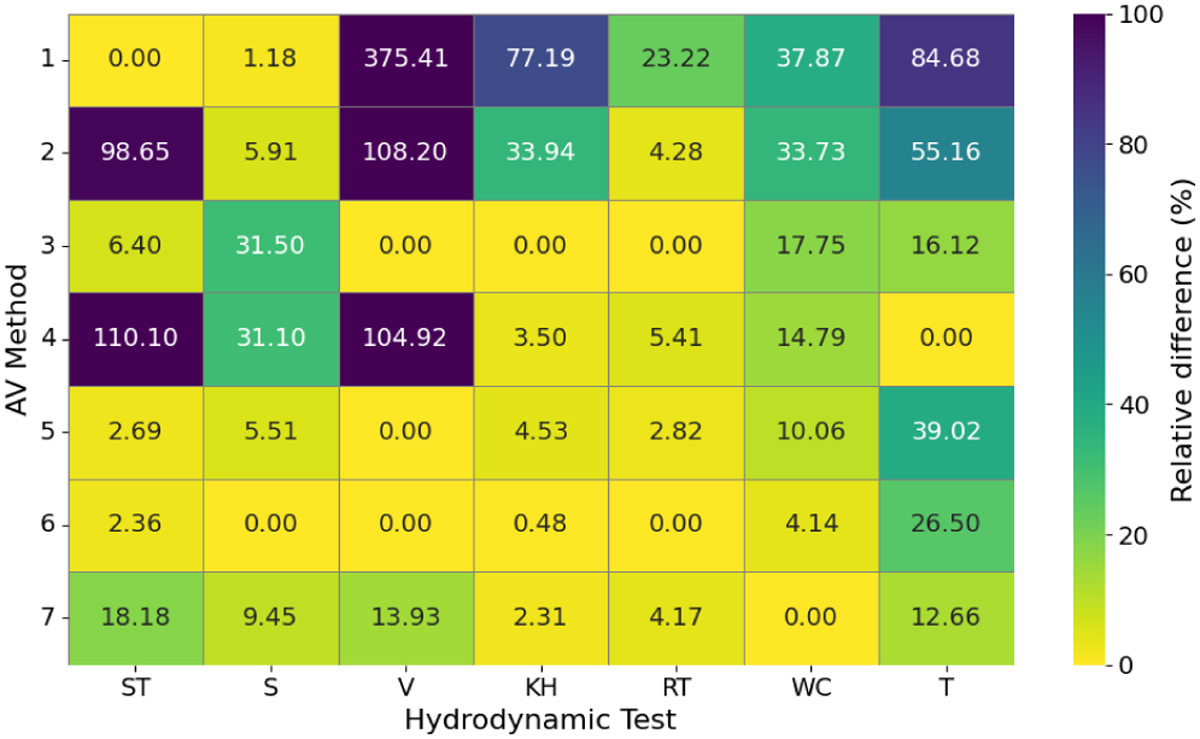
Download original image
Ranking heatmap of all AV methods for each test. Numbers show the relative difference to the best metric result overall for each test, using the values reported in Table 7. Lower values indicate better results.
Current usage metrics show cumulative count of Article Views (full-text article views including HTML views, PDF and ePub downloads, according to the available data) and Abstracts Views on Vision4Press platform.
Data correspond to usage on the plateform after 2015. The current usage metrics is available 48-96 hours after online publication and is updated daily on week days.
Initial download of the metrics may take a while.