Open Access
Fig. 11
Download original image
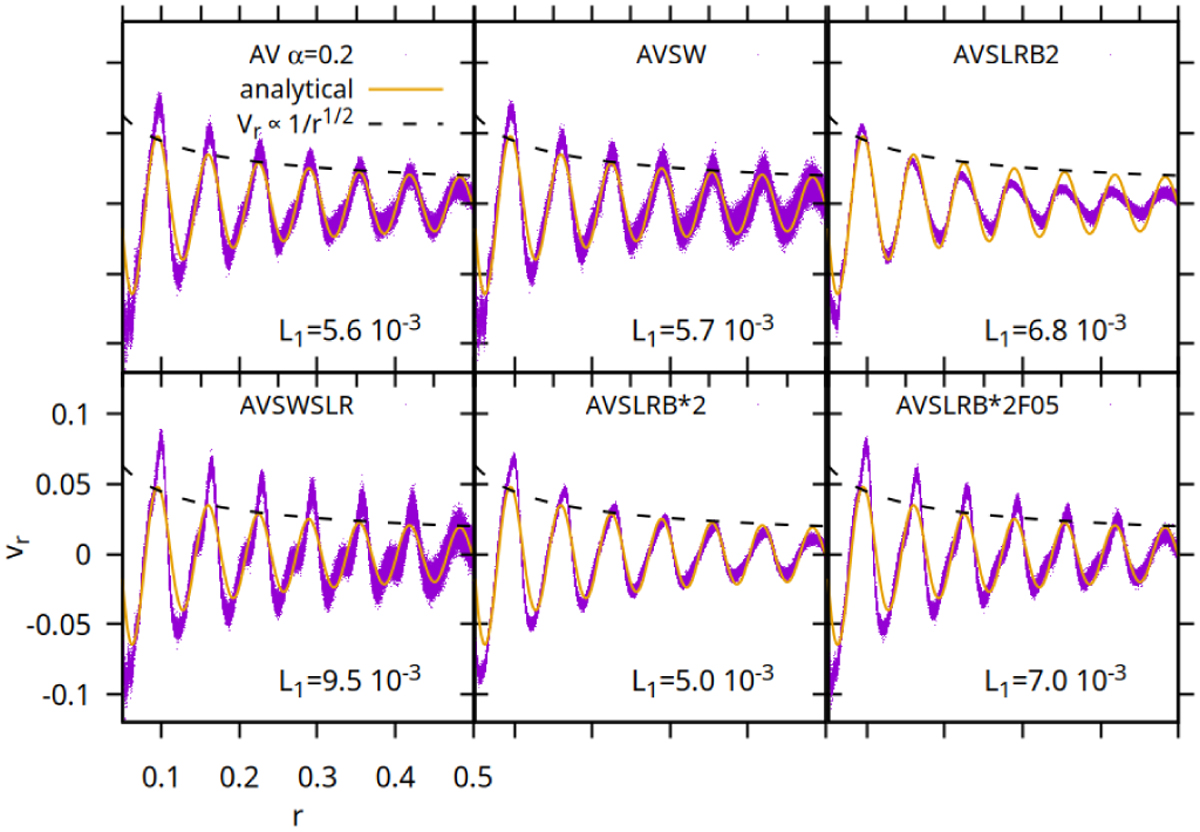
Velocity profile of a surface wave at t=0.35 calculated with the AV schemes in Table 8. The L1 values obtained are also shown when compared to the analytical result. The ![]() dependence of maximum amplitude with distance is also shown (dashed line).
dependence of maximum amplitude with distance is also shown (dashed line).
Current usage metrics show cumulative count of Article Views (full-text article views including HTML views, PDF and ePub downloads, according to the available data) and Abstracts Views on Vision4Press platform.
Data correspond to usage on the plateform after 2015. The current usage metrics is available 48-96 hours after online publication and is updated daily on week days.
Initial download of the metrics may take a while.