Open Access
Fig. 3
Download original image
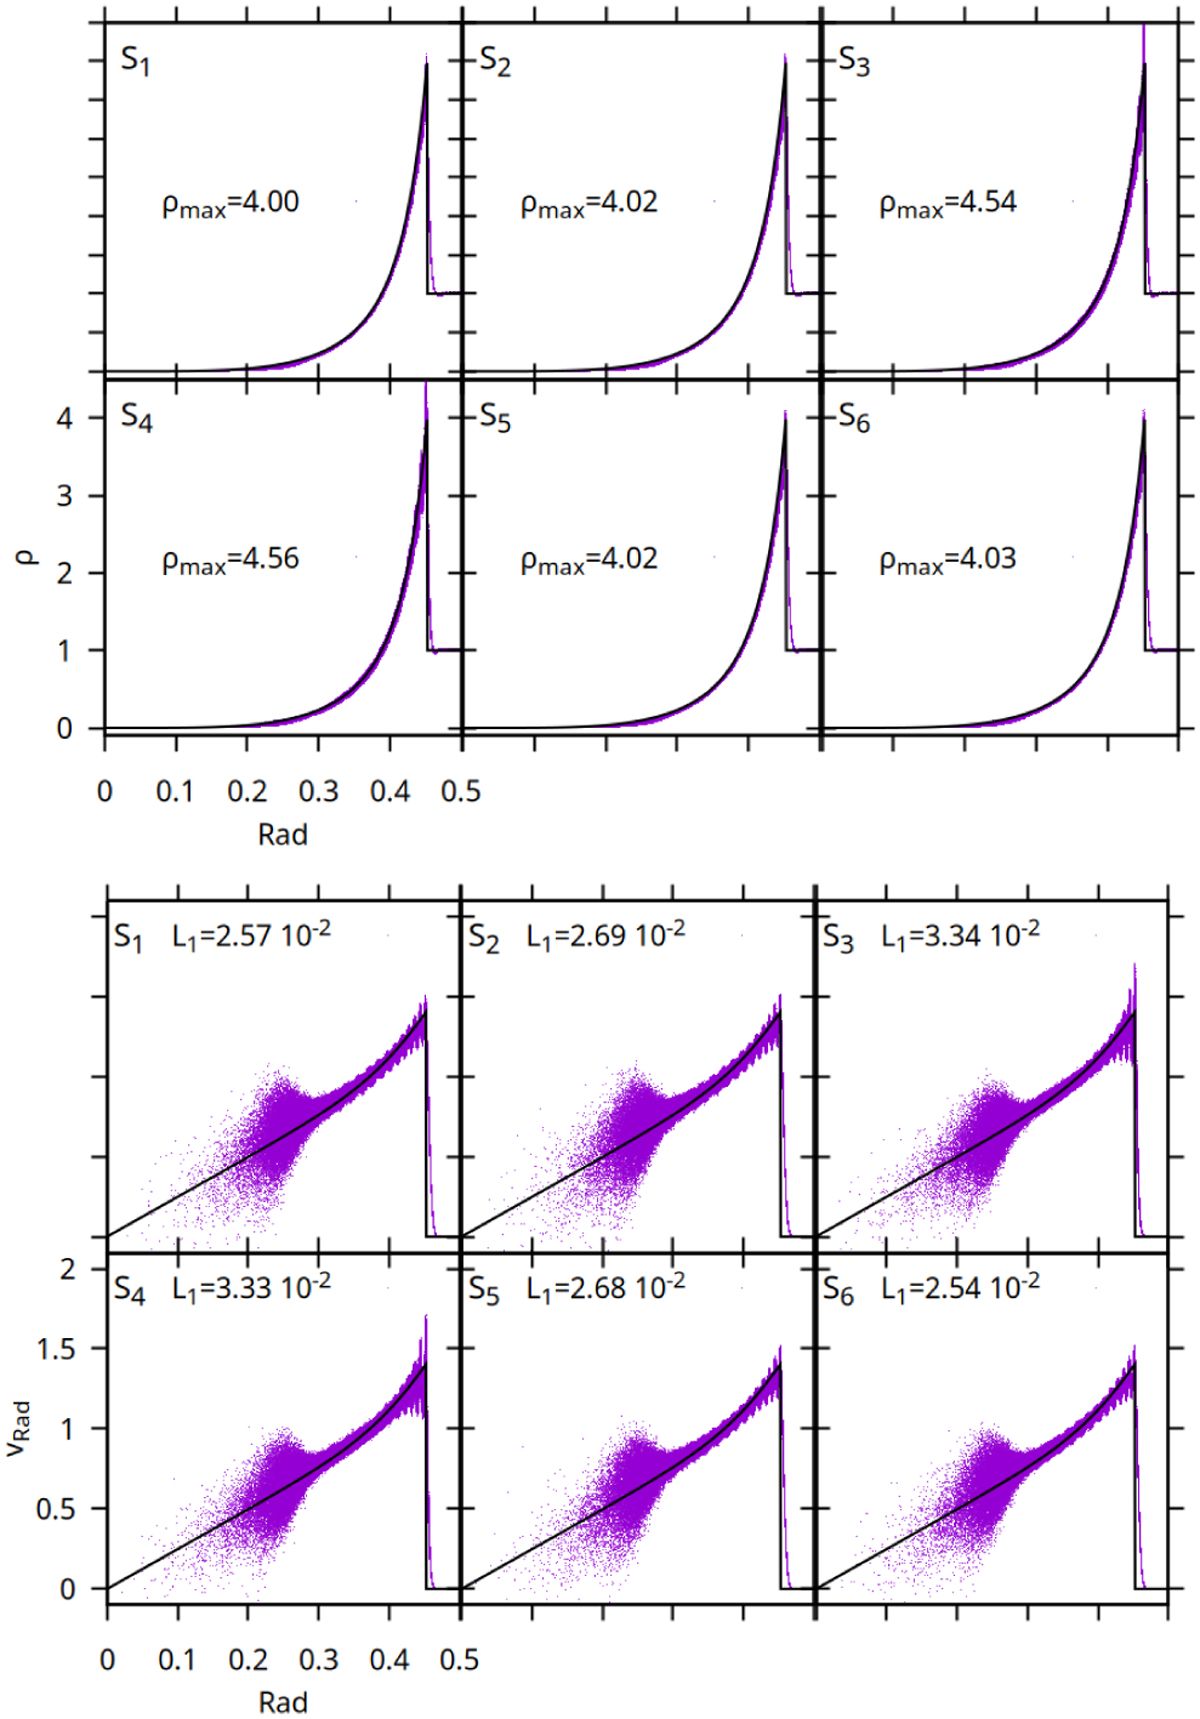
Density and radial velocity profiles in the Sedov-Taylor test at time t=1 for the different models described in Table 2. The solid line represents the analytical reference. The L1 error between the numerical and analytical estimates from the center until the maximum radial velocity is also shown.
Current usage metrics show cumulative count of Article Views (full-text article views including HTML views, PDF and ePub downloads, according to the available data) and Abstracts Views on Vision4Press platform.
Data correspond to usage on the plateform after 2015. The current usage metrics is available 48-96 hours after online publication and is updated daily on week days.
Initial download of the metrics may take a while.