Open Access
Fig. 4
Download original image
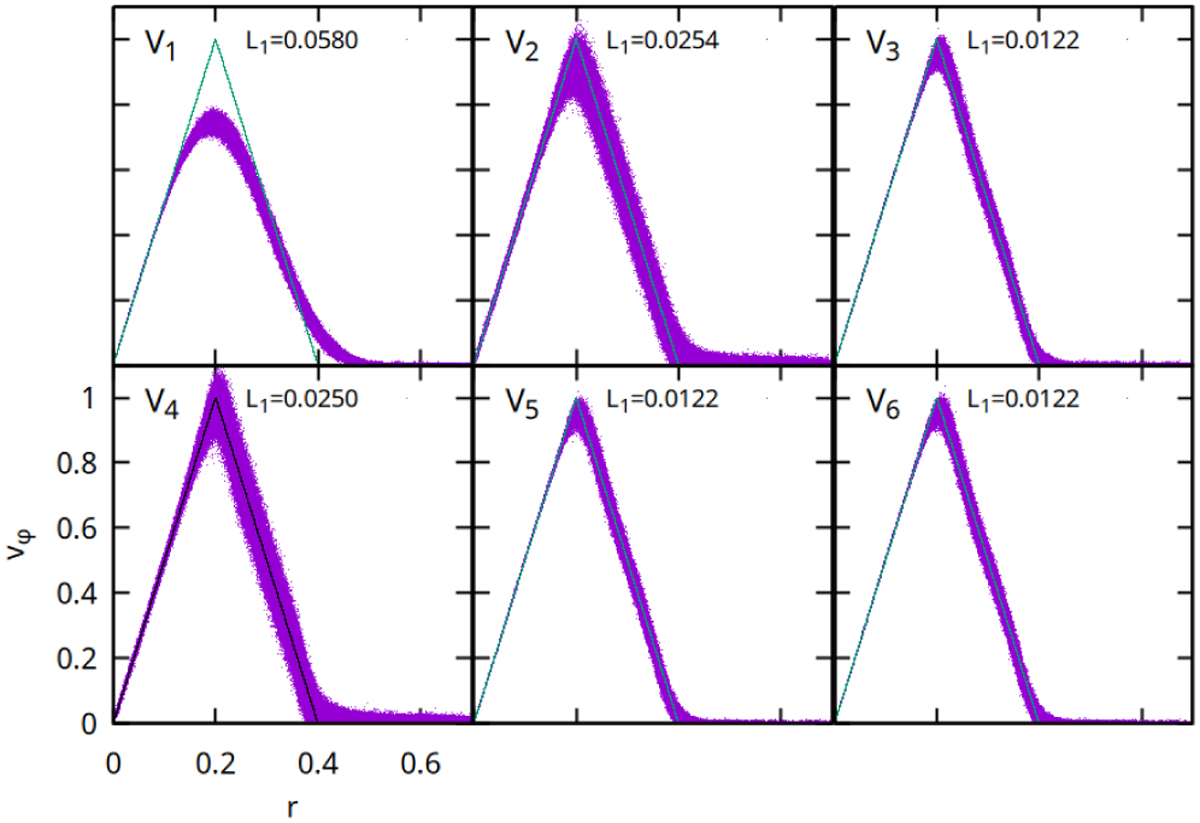
Azimuthal velocity distribution in the Gresho–Chan vortex experiment at t=1 for the model Vk in the third row in Table 2. The analytical reference is indicated by the continuum line.
Current usage metrics show cumulative count of Article Views (full-text article views including HTML views, PDF and ePub downloads, according to the available data) and Abstracts Views on Vision4Press platform.
Data correspond to usage on the plateform after 2015. The current usage metrics is available 48-96 hours after online publication and is updated daily on week days.
Initial download of the metrics may take a while.