Fig. A.1
Download original image
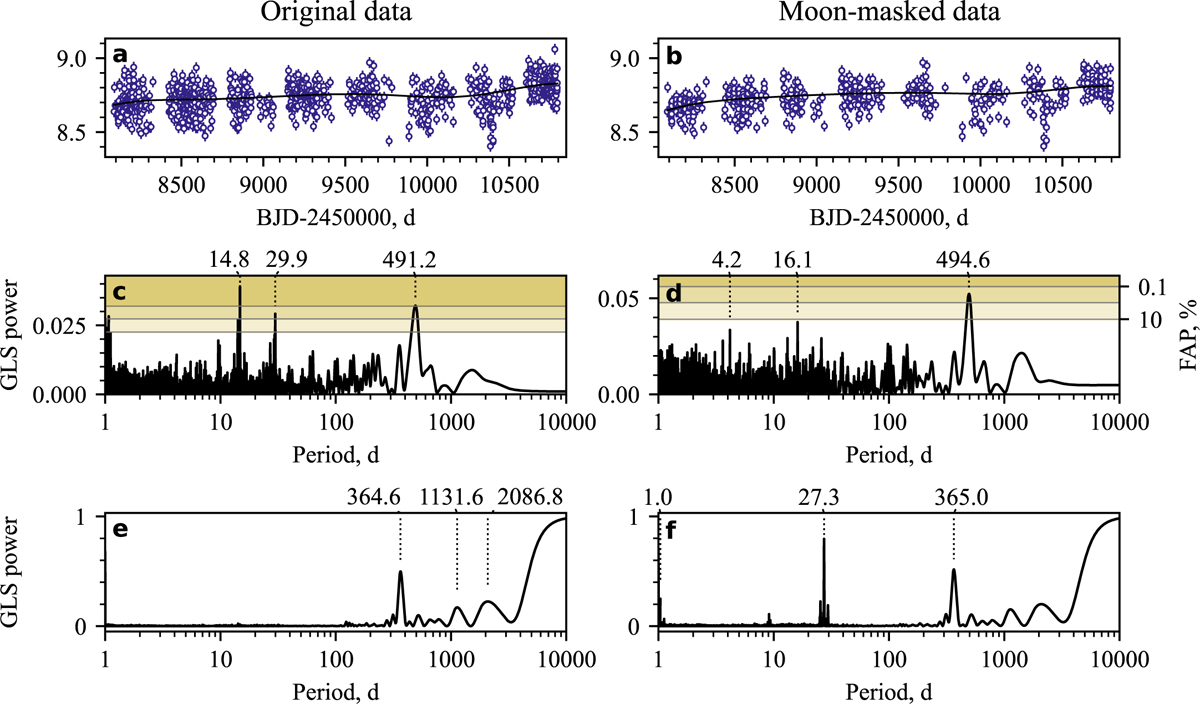
ASAS-SN photometry, periodograms, and window functions. Panels (a) and (b) show the full and Moon-masked photometric datasets, respectively, together with the spline fits used to remove long-term trends. Panels (c) and (d) present the corresponding GLS periodograms, while panels (e) and (f) display their window functions. Our data curation alters the window function, as observations discarded due to Moon contamination occur at regular intervals. In the full dataset, strong peaks appear near ∼29.9 and ∼ 14.8 days, corresponding to the lunar synodic period and its first harmonic. These peaks disappear completely in the Moon-masked data. A peak at 491.2 days (full dataset) and 494.6 days (Moon-masked dataset) lies close to the 0.1% FAP level. However, this signal does not persist coherently across multiple observing windows, and given the overall data quality, we do not consider it further in our analysis.
Current usage metrics show cumulative count of Article Views (full-text article views including HTML views, PDF and ePub downloads, according to the available data) and Abstracts Views on Vision4Press platform.
Data correspond to usage on the plateform after 2015. The current usage metrics is available 48-96 hours after online publication and is updated daily on week days.
Initial download of the metrics may take a while.