Fig. A.2
Download original image
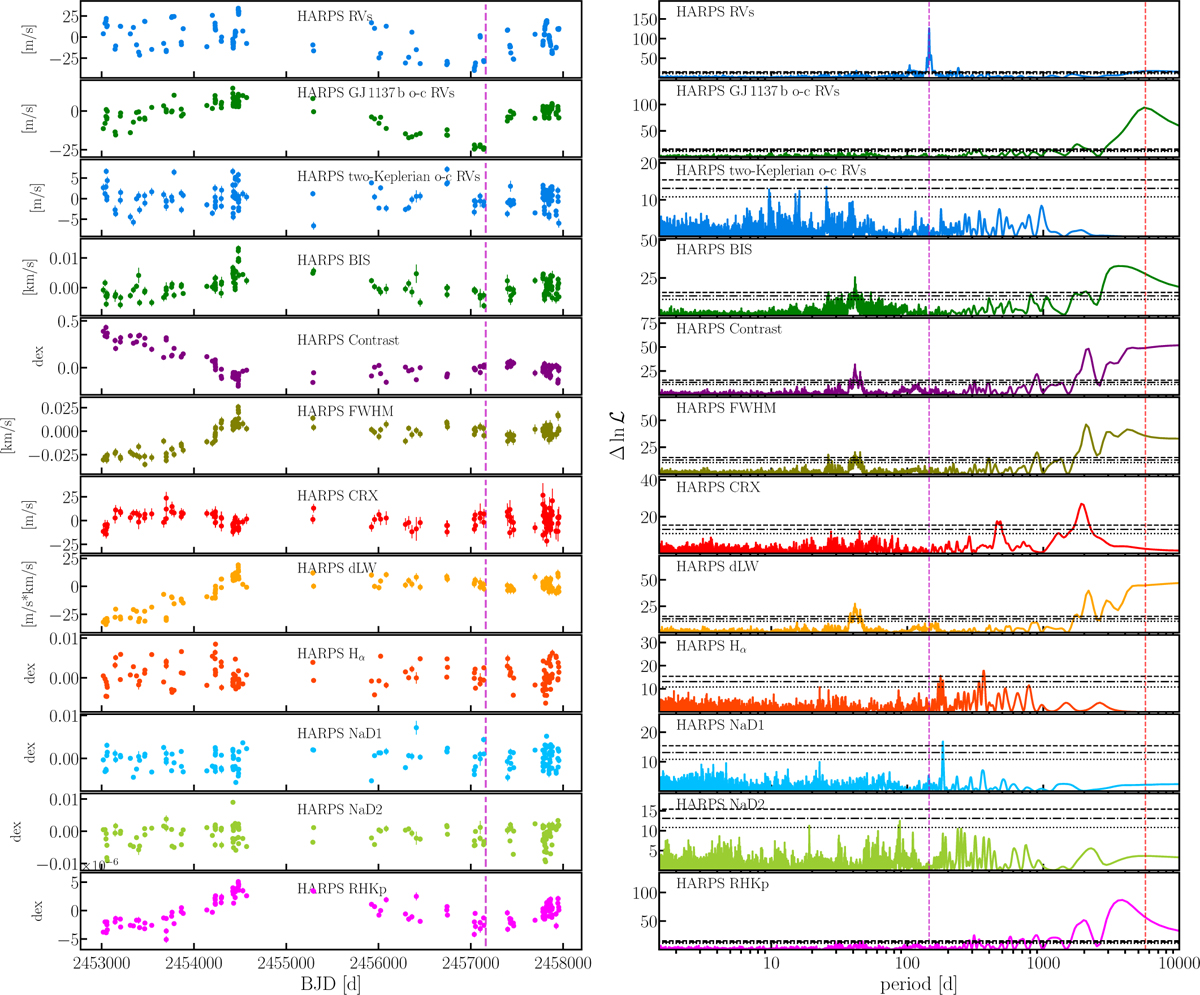
Time series data and MLS power spectrum of the HARPS RVs and stellar activity indicators of GJ 1137. The left sub-panels show the individual RVs, the residuals of fitting the GJ 1137 b signal, and the two-Keplerian fit residuals including the long-period RV component. The rest are the HARPS activity indices as labelled in the panels. The vertical magenta line notates the HARPS-fibre change from which point we treat the pre- and post-HARPS data with a separate offset parameter. The right panel shows the individual MLP power spectrum in terms of ∆lnL as indicated in the sub-panels. The horizontal lines in the MLP periodograms show the FAP levels of 10%, 1%, and 0.1%, the latter of which is considered significant. The magenta vertical line indicates the orbital period of GJ 1137 b, whereas the red line indicates the best-fit long-term period seen in the one-planet Keplerian model residuals.
Current usage metrics show cumulative count of Article Views (full-text article views including HTML views, PDF and ePub downloads, according to the available data) and Abstracts Views on Vision4Press platform.
Data correspond to usage on the plateform after 2015. The current usage metrics is available 48-96 hours after online publication and is updated daily on week days.
Initial download of the metrics may take a while.