Open Access
Fig. A.5
Download original image
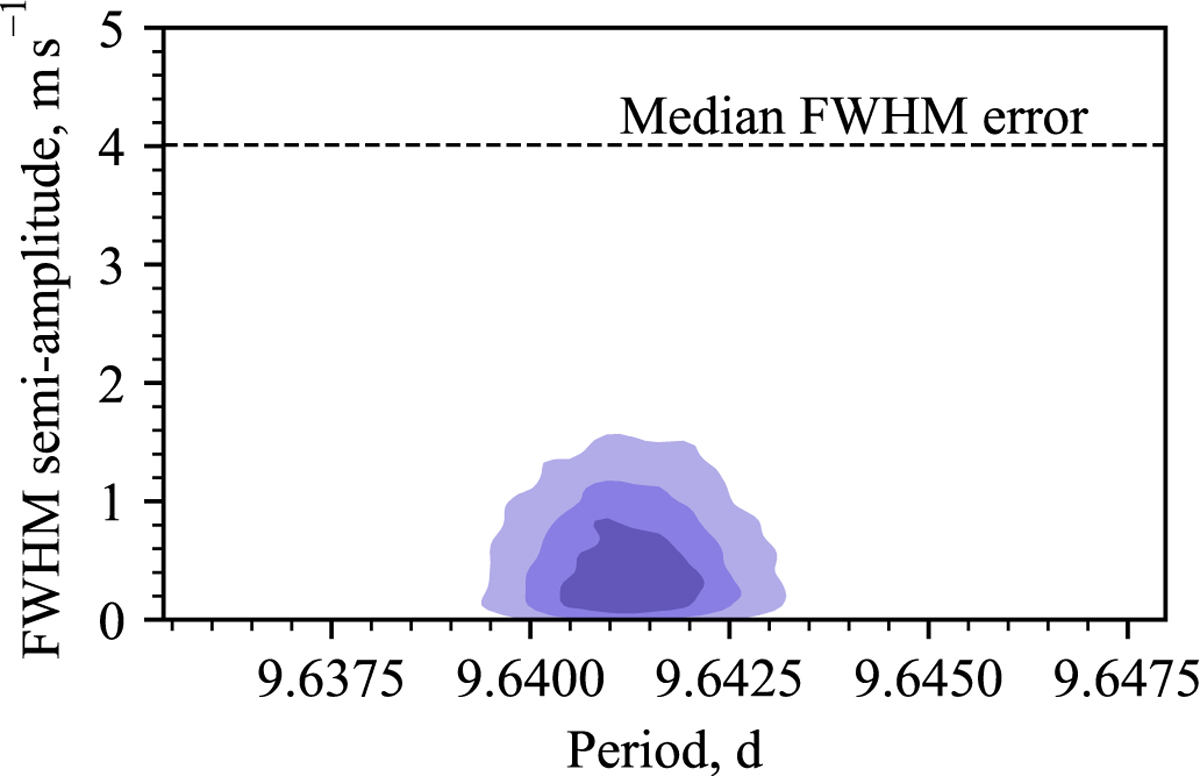
FWHM amplitude-period distribution in our search for a common RV&FWHM signal in the data. The shaded contours highlight 25%, 50%, and 75% of the enclosed probability mass. The median FWHM error is marked with a solid dashed line.
Current usage metrics show cumulative count of Article Views (full-text article views including HTML views, PDF and ePub downloads, according to the available data) and Abstracts Views on Vision4Press platform.
Data correspond to usage on the plateform after 2015. The current usage metrics is available 48-96 hours after online publication and is updated daily on week days.
Initial download of the metrics may take a while.