Open Access
Fig. A.6
Download original image
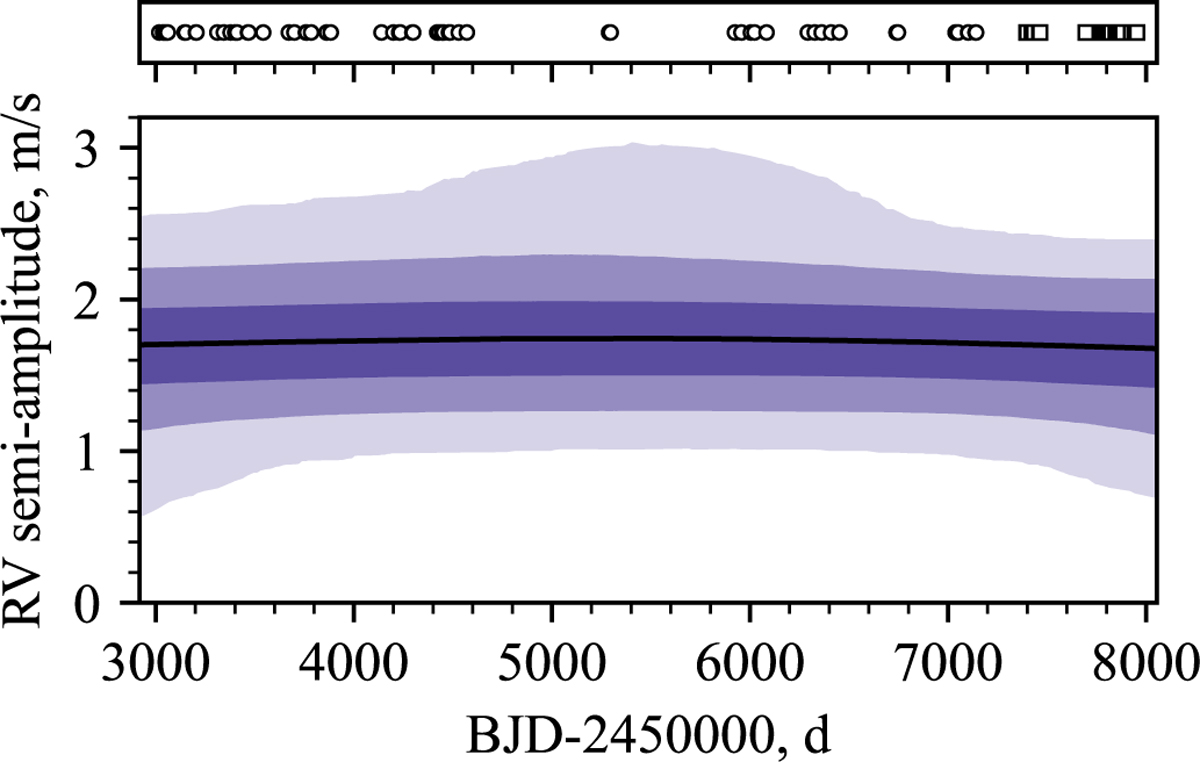
Stability of the RV signal induced by GJ 1137 c through an apodisation test. Centre: the median value (solid black line), as well as the 1σ, 2σ, and 3σ confidence intervals (shaded bands) of the apodised signal over time. Top: timestamps of measurements, with markers following Fig. 3.
Current usage metrics show cumulative count of Article Views (full-text article views including HTML views, PDF and ePub downloads, according to the available data) and Abstracts Views on Vision4Press platform.
Data correspond to usage on the plateform after 2015. The current usage metrics is available 48-96 hours after online publication and is updated daily on week days.
Initial download of the metrics may take a while.