Fig. 6
Download original image
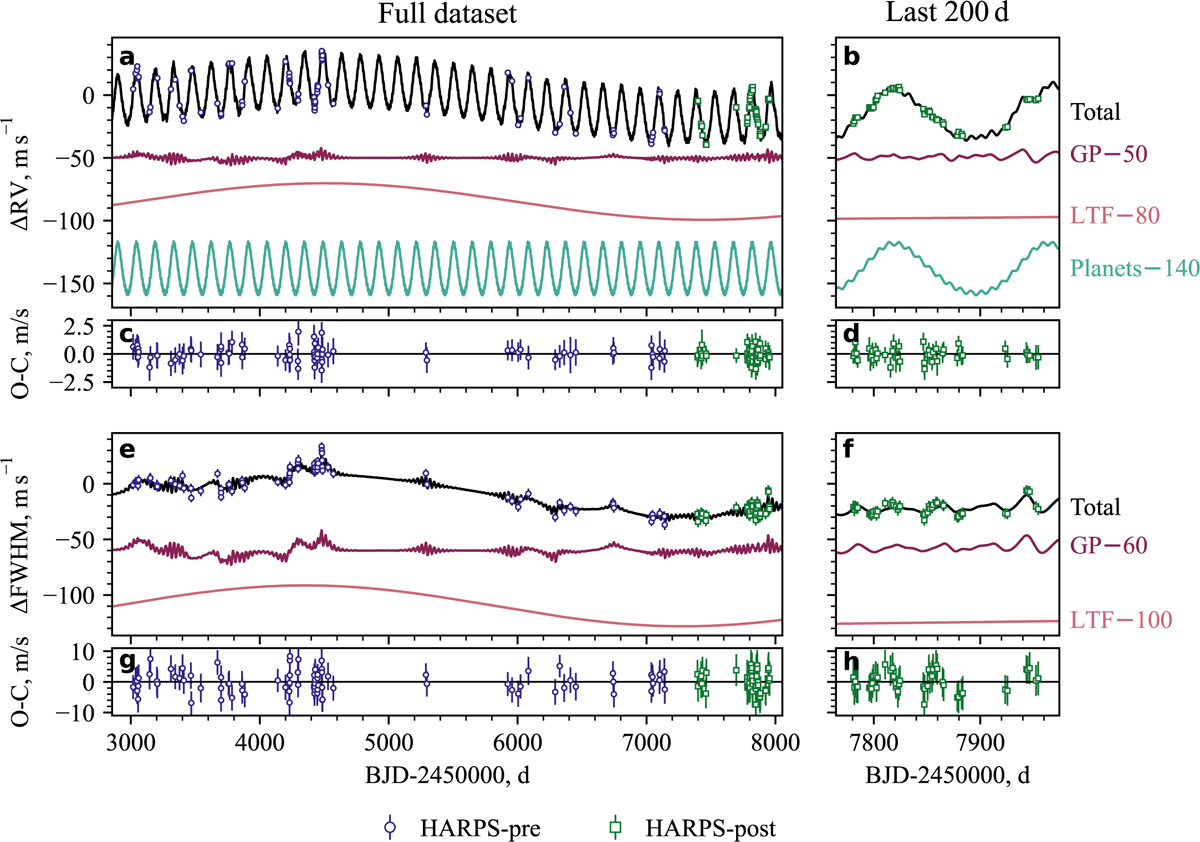
Time series (error bars) against our best model (solid lines) over the full dataset and over a selected temporal region. Data points come with error bars that account for the instrument and the model jitter. (a, b) SERVAL RV, where the full model (black) is split into the stellar-activity GP component (red), the LTF (pink), and the two-planet component (teal). (c, d) Associated RV residuals. (e, f) RACCOON FWHM, where the full model (black) is split into the stellar-activity GP component (red) and the LTF (pink). We implicitly correct for the HARPS-pre FWHM drift before visualising. Every component is offset by an arbitrary amount, labelled in the plots. (g, h) Associated FWHM residuals.
Current usage metrics show cumulative count of Article Views (full-text article views including HTML views, PDF and ePub downloads, according to the available data) and Abstracts Views on Vision4Press platform.
Data correspond to usage on the plateform after 2015. The current usage metrics is available 48-96 hours after online publication and is updated daily on week days.
Initial download of the metrics may take a while.