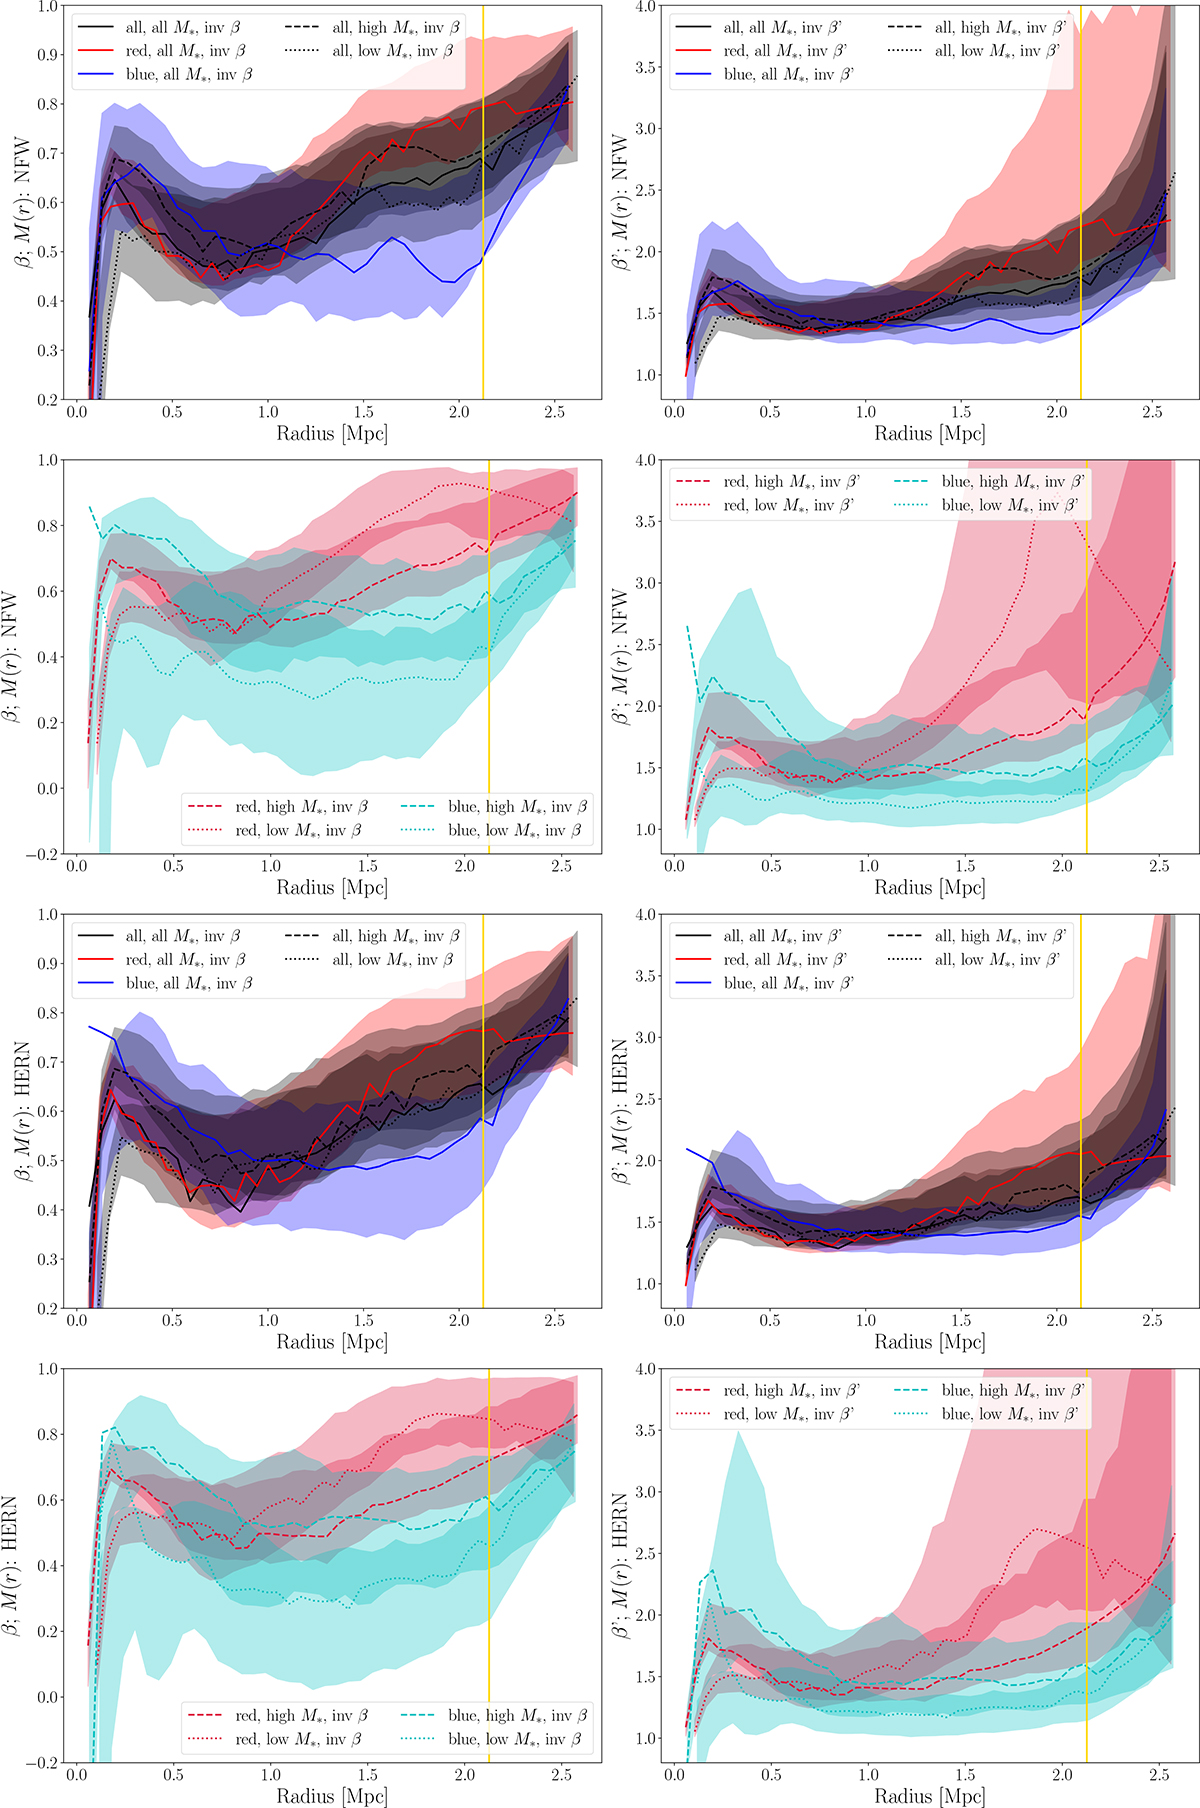
Fig. C.1.
Download original image
Results of the JI method for all cluster member populations. In the left column, we show the β(r) values, while on the right one we plot those of β′(r) = σr/σϑ. In the upper half of this figure (see label of each vertical axis), results are based on a NFW total mass profile, while in the lower half on Hernquist profile. The shaded regions represent the 1σ confidence intervals (see Sect. 7.4.1 for further details), while the yellow line represents the R200c of the stacked cluster.
Current usage metrics show cumulative count of Article Views (full-text article views including HTML views, PDF and ePub downloads, according to the available data) and Abstracts Views on Vision4Press platform.
Data correspond to usage on the plateform after 2015. The current usage metrics is available 48-96 hours after online publication and is updated daily on week days.
Initial download of the metrics may take a while.