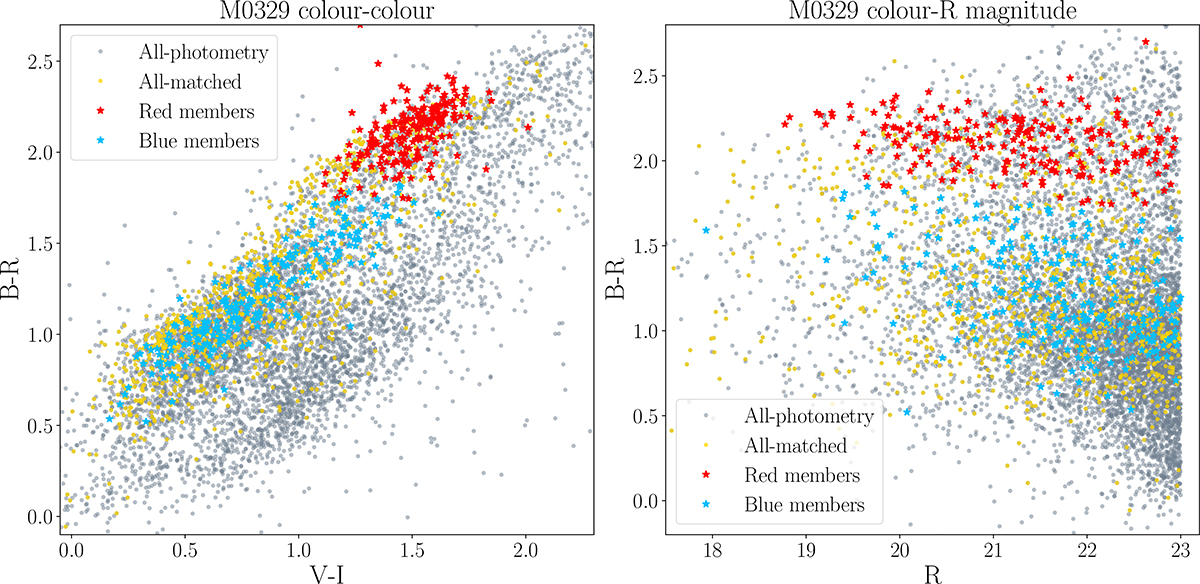
Fig. 2.
Download original image
Colour subdivision for the members of M0329, both on the colour-colour plane (V−I versus B−R; left panel) and on the R-band magnitude versus B−R colour plane (right panel). The latter is the plot used to determine which galaxies are red and which are not, according to the recursive red sequence linear fit. The “all-matched” entry in the legend, corresponding to the yellow points, represents the objects in the photometric catalogue that have a match in the spectroscopic catalogue.
Current usage metrics show cumulative count of Article Views (full-text article views including HTML views, PDF and ePub downloads, according to the available data) and Abstracts Views on Vision4Press platform.
Data correspond to usage on the plateform after 2015. The current usage metrics is available 48-96 hours after online publication and is updated daily on week days.
Initial download of the metrics may take a while.