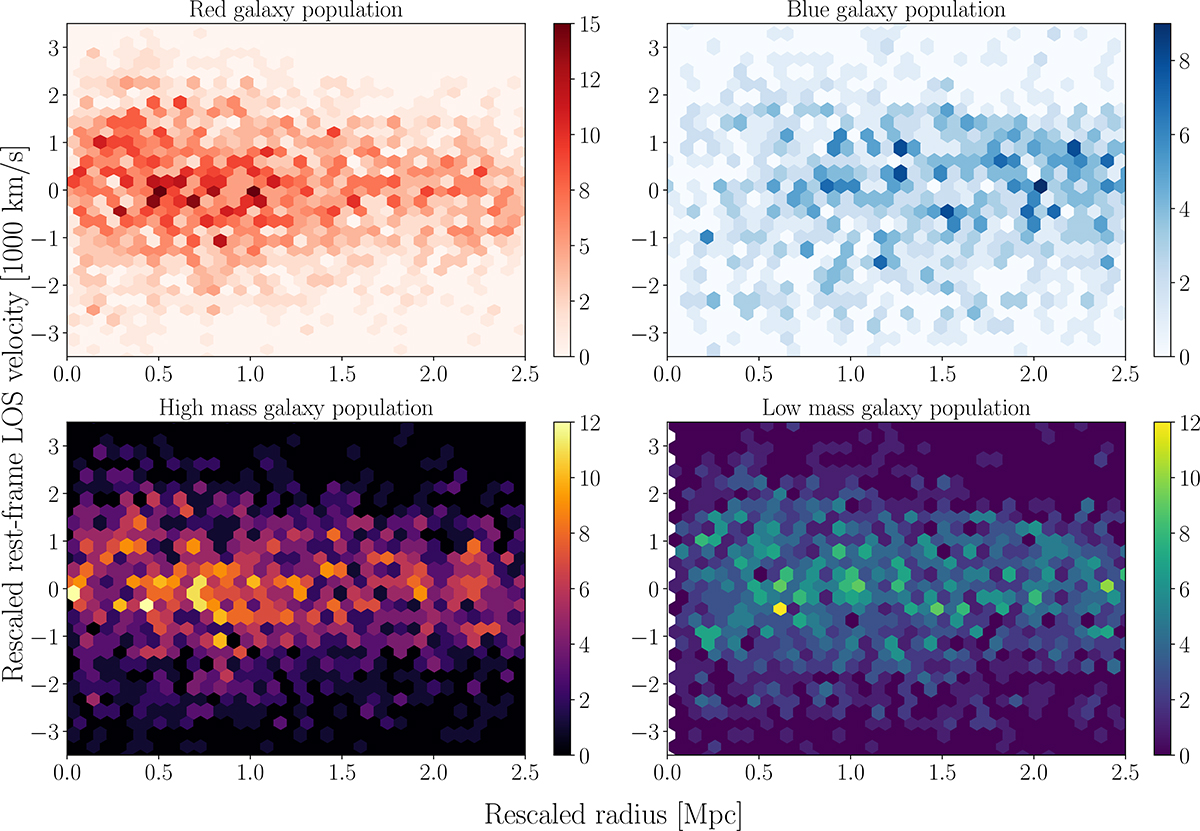
Fig. 3.
Download original image
PPS of major cluster-member populations of this work, re-scaled by the mean value of R200c and v200. The scale at the right of every plot represents the number of objects in each bin. We note that the blue galaxies, as expected, are more concentrated towards the outer regions of our ensemble cluster, while the red ones are mostly found in the inner regions. The HM population, despite it being radially distributed almost the same as the LM population, is slightly less spread out in terms of velocity than the latter.
Current usage metrics show cumulative count of Article Views (full-text article views including HTML views, PDF and ePub downloads, according to the available data) and Abstracts Views on Vision4Press platform.
Data correspond to usage on the plateform after 2015. The current usage metrics is available 48-96 hours after online publication and is updated daily on week days.
Initial download of the metrics may take a while.