Fig. 4.
Download original image
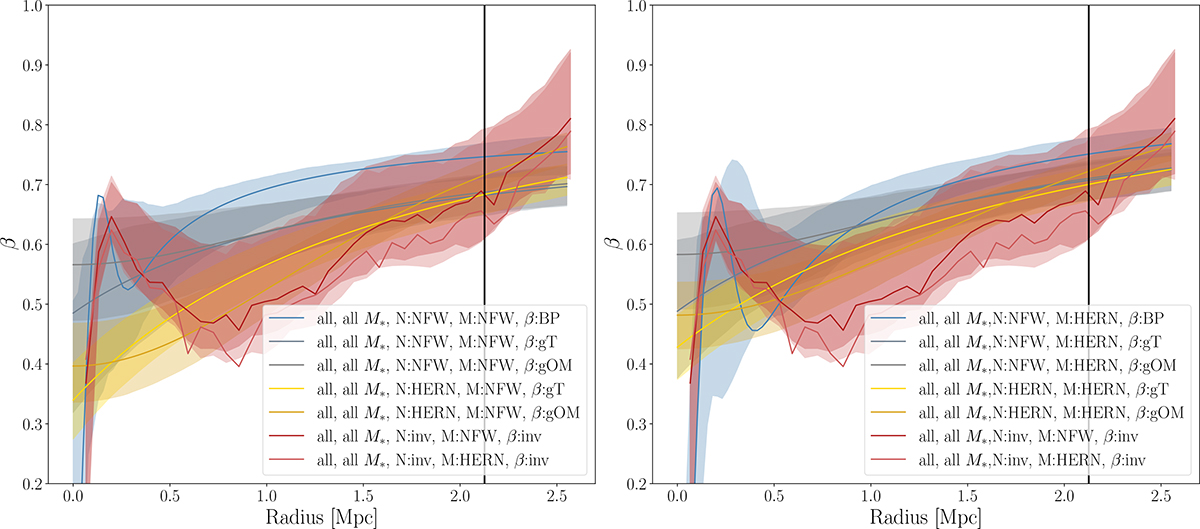
Comparison between β(r) profiles from the two methods of the whole cluster member population. In the left panel, we plot all the MAMPOSSt outcomes with an NFW total mass profile, as well as both the JI results (NFW and Hernquist) for reference. In the right panel, similarly, we plot all the MAMPOSSt outcomes with a Hernquist total mass profile. The vertical black line represents the R200c of the stacked cluster.
Current usage metrics show cumulative count of Article Views (full-text article views including HTML views, PDF and ePub downloads, according to the available data) and Abstracts Views on Vision4Press platform.
Data correspond to usage on the plateform after 2015. The current usage metrics is available 48-96 hours after online publication and is updated daily on week days.
Initial download of the metrics may take a while.