Fig. A.1.
Download original image
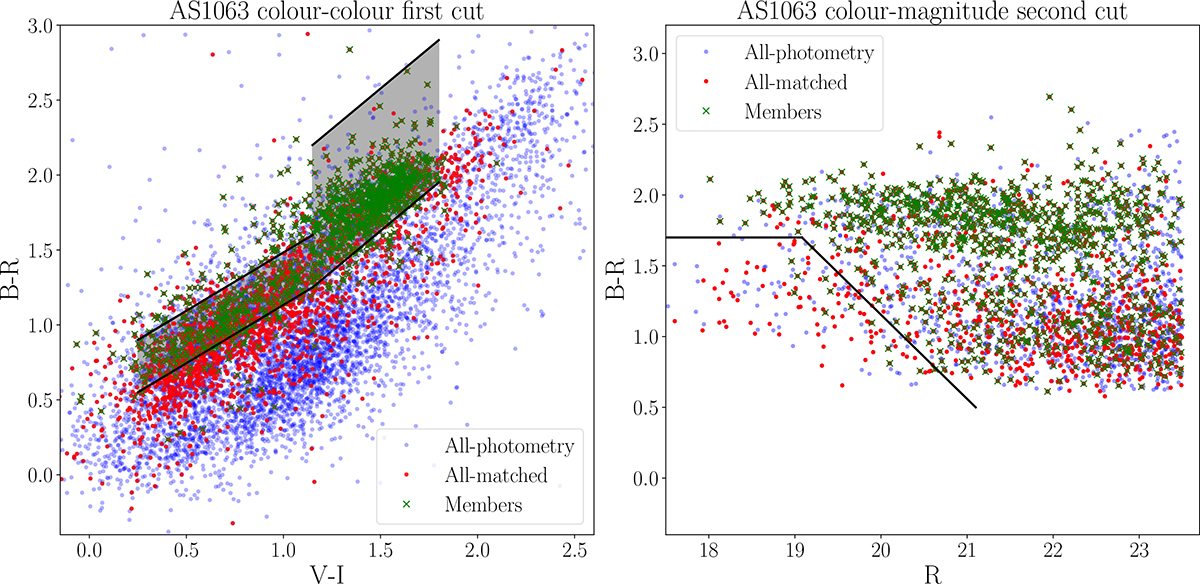
Colour cuts operated on the AS1063 catalogues. In the left panel, we report the first cut (grey region marked by black boundaries) in the colour-colour plane V−I versus B−R. In the right panel, we report the cut (second cut), operated in the R band magnitude versus B−R colour plane, of the subsample extracted from the first cut. The selected objects in this panel are those above the black line. The "all-matched" entry in the legend, corresponding to the red points, indicates the objects in the photometric catalogue that have a match in the spectroscopic catalogue.
Current usage metrics show cumulative count of Article Views (full-text article views including HTML views, PDF and ePub downloads, according to the available data) and Abstracts Views on Vision4Press platform.
Data correspond to usage on the plateform after 2015. The current usage metrics is available 48-96 hours after online publication and is updated daily on week days.
Initial download of the metrics may take a while.