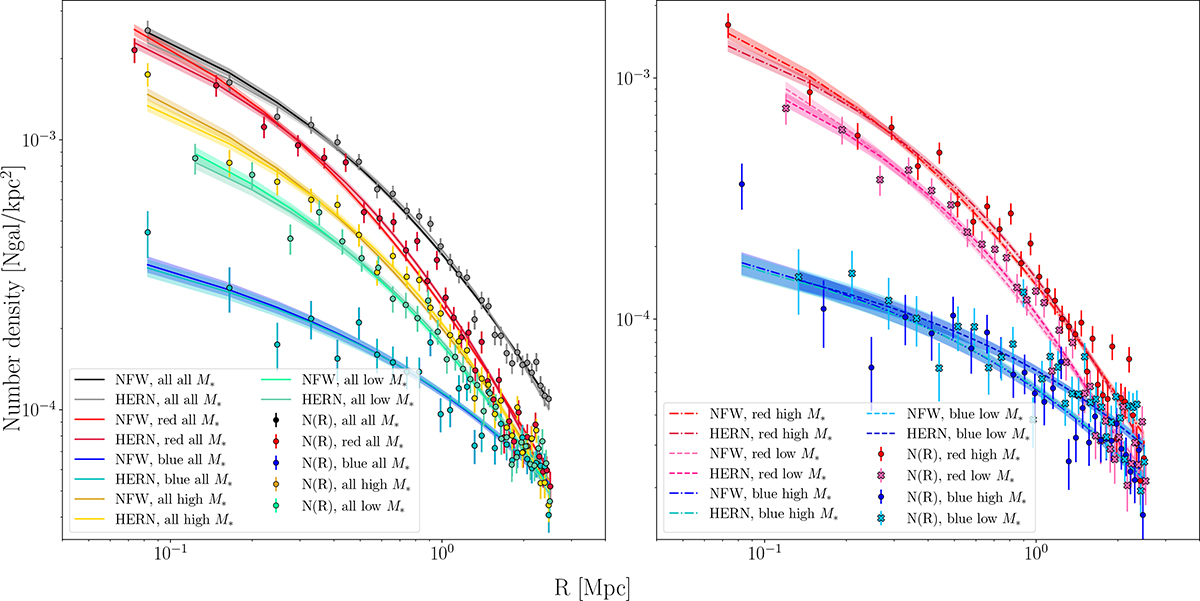
Fig. B.1.
Download original image
Projected number density profiles, N(R), for all the considered subsamples of galaxy populations after stacking. In the left panel, we show the N(R) of the main galaxy populations (all red galaxies, all blue galaxies, etc), as well as the N(R) of the whole sample of selected cluster members. In the right panel, we show the four subcategories of the main populations (red with high M*, blue with low M*, etc)
Current usage metrics show cumulative count of Article Views (full-text article views including HTML views, PDF and ePub downloads, according to the available data) and Abstracts Views on Vision4Press platform.
Data correspond to usage on the plateform after 2015. The current usage metrics is available 48-96 hours after online publication and is updated daily on week days.
Initial download of the metrics may take a while.