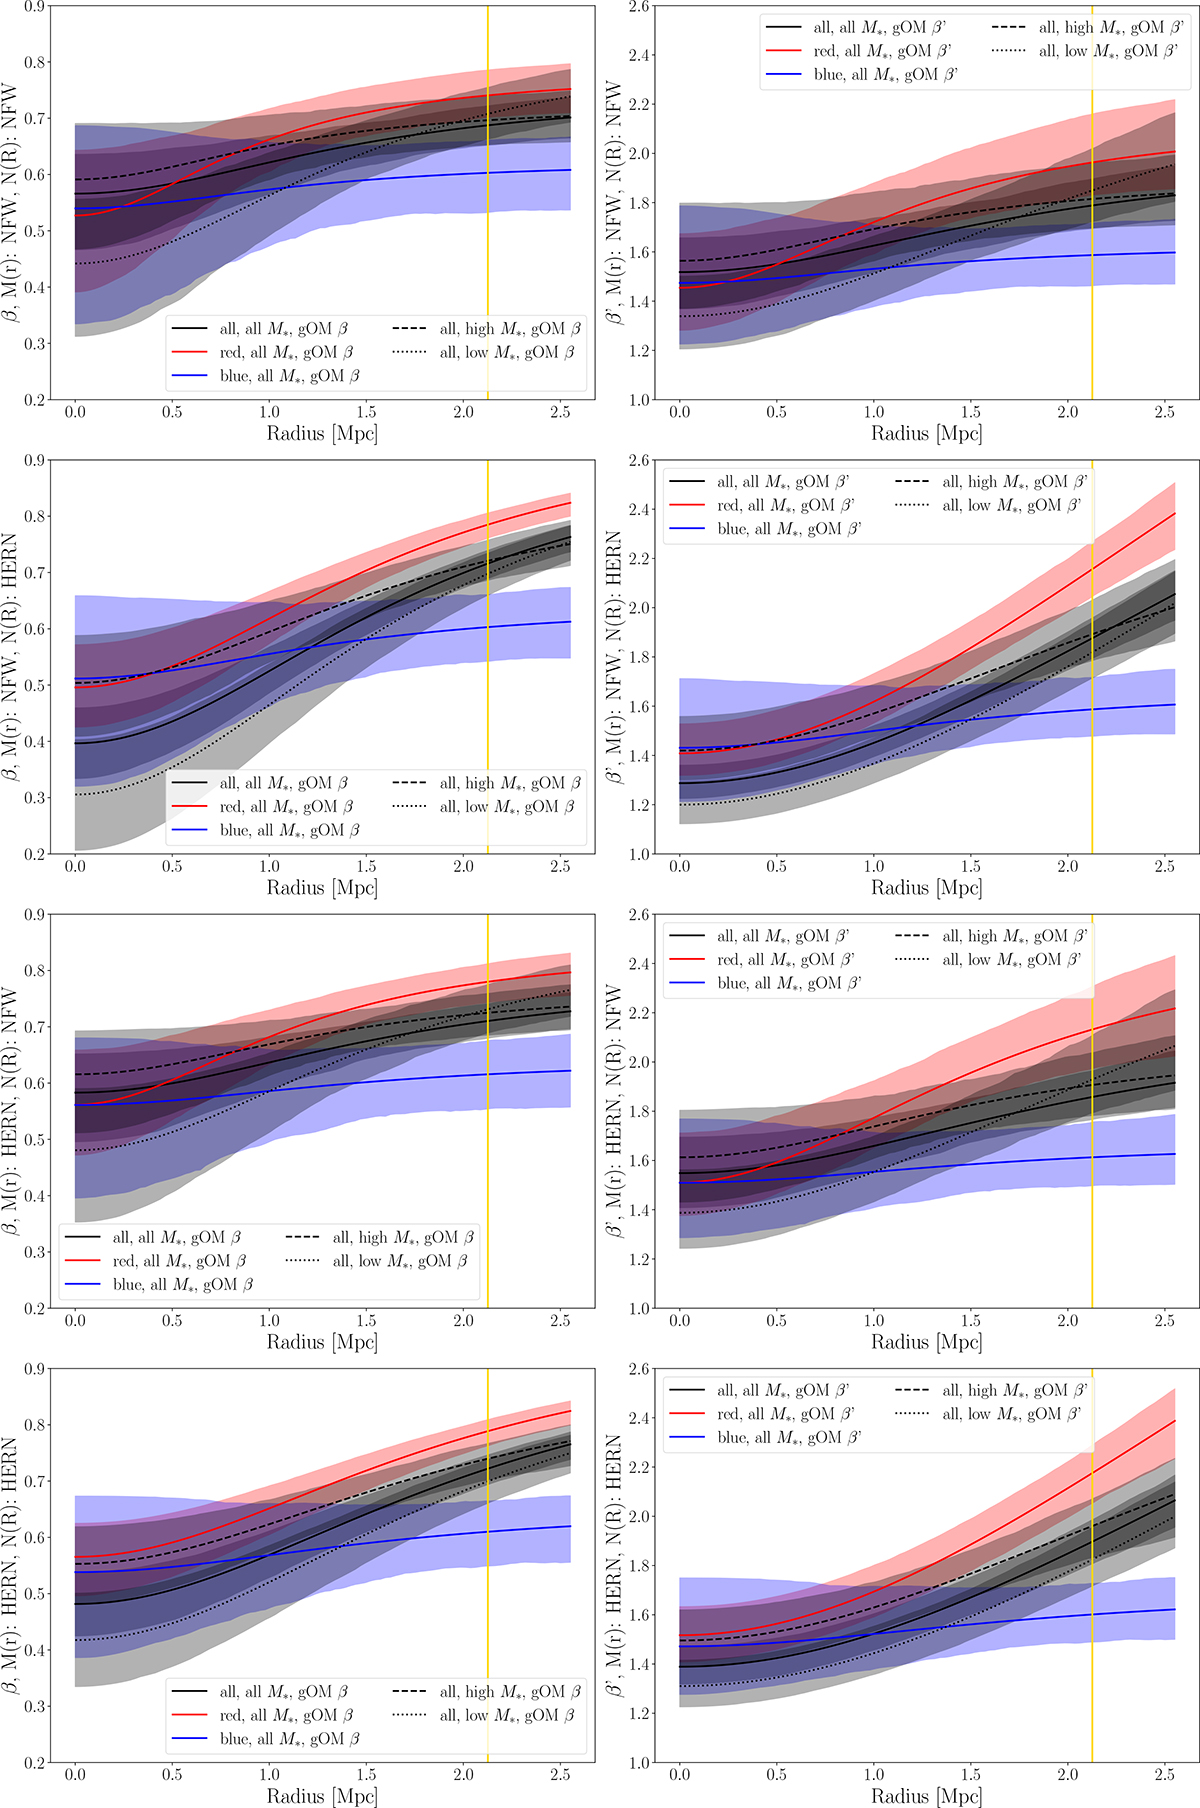
Fig. B.2.
Download original image
Results of the gOM anisotropy model for the major cluster member populations. In the left column, we show the β(r) values, while, on the right one, we plot those of β′(r) = σr/σϑ. The four rows are organised to distinguish the different mass and number density models adopted in each situation, and they are specified on the label of each vertical axis. The shadowed region represents the 1σ confidence interval, while the yellow line represents the R200c of the stacked cluster.
Current usage metrics show cumulative count of Article Views (full-text article views including HTML views, PDF and ePub downloads, according to the available data) and Abstracts Views on Vision4Press platform.
Data correspond to usage on the plateform after 2015. The current usage metrics is available 48-96 hours after online publication and is updated daily on week days.
Initial download of the metrics may take a while.