Fig. 11
Download original image
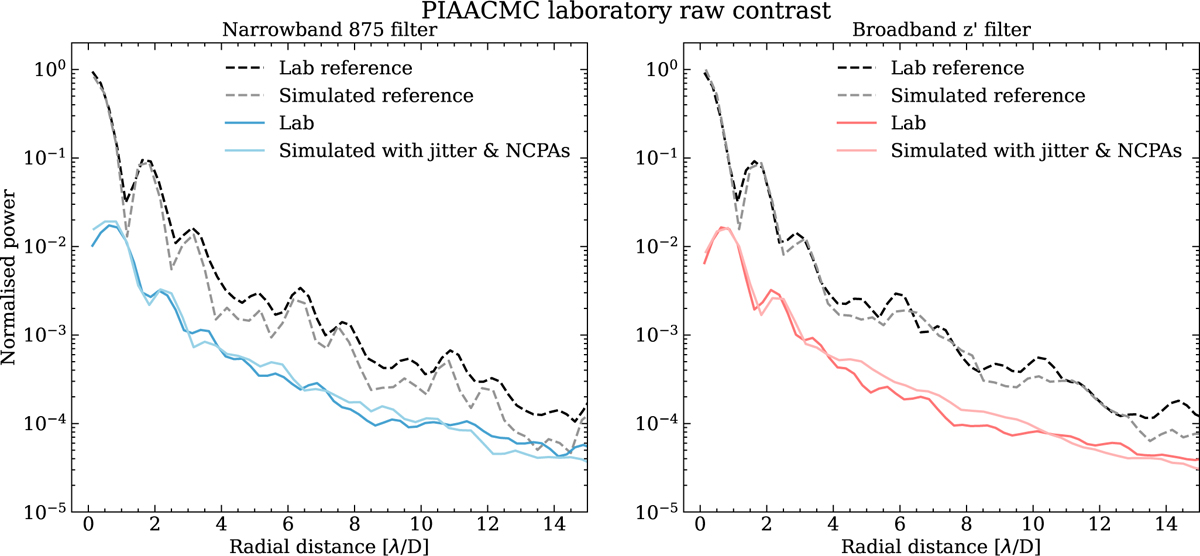
Raw contrast curves as a mean radial profile, measured with the instrument’s internal source and simulated with the measurements of the manufactured mask, for the narrowband 875 filter on the left and the broadband z’ filter on the right. In both panels, the grey dashed line (simulated reference) shows the simulated non-coronagraphic PSF, the lighter solid line (simulated with jitter & NCPAs) shows the simulated contrast with measurements of the manufactured mask and perturbations including a jitter of 7 mas RMS and typical residual NCPAs from MagAO-X, the darker solid line (lab) shows the measured contrast with the internal source, and the dashed black line (lab reference) shows the measured non-coronagraphic PSF with the internal source. In this experimental setup, all elements are in the beam (bump mask, forward PIAA lenses set, focal plane mask, Lyot stop, inverse PIAA lenses set), and the focal plane mask is taken out of the beam only to measure the reference.
Current usage metrics show cumulative count of Article Views (full-text article views including HTML views, PDF and ePub downloads, according to the available data) and Abstracts Views on Vision4Press platform.
Data correspond to usage on the plateform after 2015. The current usage metrics is available 48-96 hours after online publication and is updated daily on week days.
Initial download of the metrics may take a while.