Fig. 9
Download original image
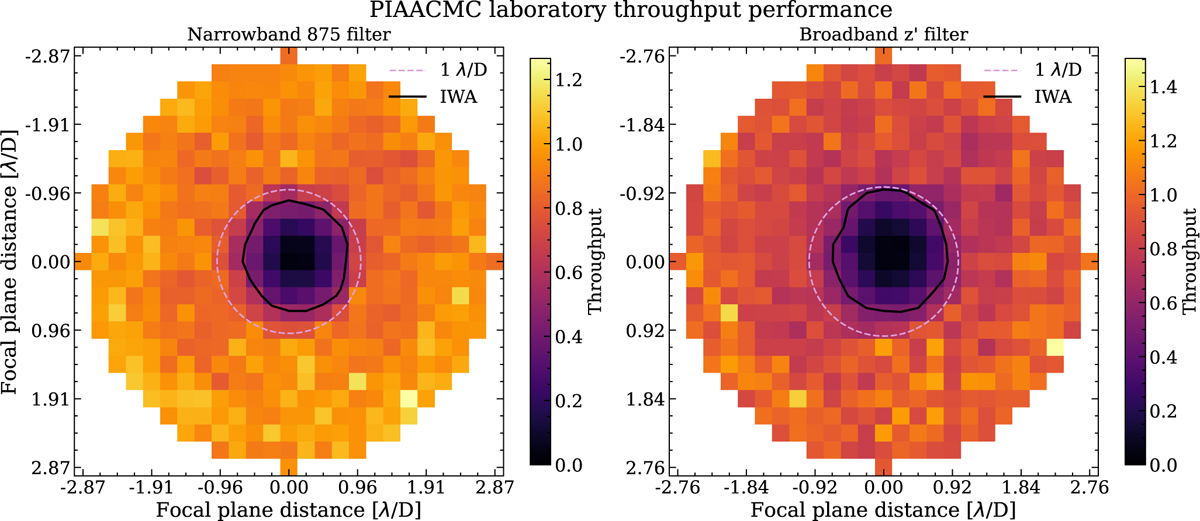
PIAACMC 2D laboratory throughput maps and their IWAs, for the narrowband 875 filter on the left, and the broadband z′ filter on the right. In this experimental setup, all elements are in the beam (bump mask, forward PIAA lenses set, focal plane mask, Lyot stop, inverse PIAA lenses set). The dashed purple line shows 1 λ/D separations around the optical axis, and the solid black line shows where throughput is 0.5 (IWA). Note that, although the data was normalised for laser power variations, residual fluctuations are causing the computed throughput to exceed unity at a few scanned positions. The colourbars of the two panels are different.
Current usage metrics show cumulative count of Article Views (full-text article views including HTML views, PDF and ePub downloads, according to the available data) and Abstracts Views on Vision4Press platform.
Data correspond to usage on the plateform after 2015. The current usage metrics is available 48-96 hours after online publication and is updated daily on week days.
Initial download of the metrics may take a while.