Fig. 4
Download original image
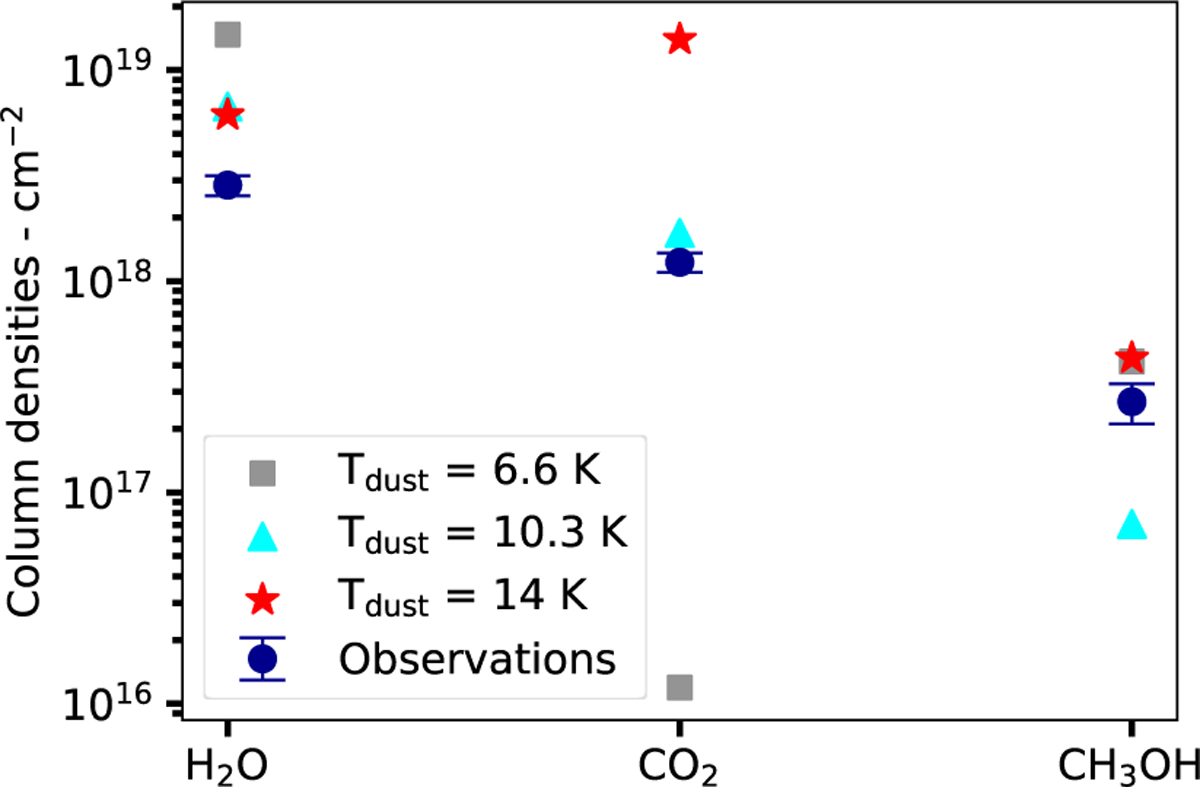
Observed column densities for H2O, CO2 and CH3OH and their uncertainties as derived in Boogert et al. (2011) towards the background star 2MASS J18170957-0814136, shown in dark blue. We also plot the column densities predicted by three different models aiming to reproduce the observed CO2 column density. Except the dust temperature, they all share the same physical parameters retrieved from Herschel data of the cold core L429-C (see text). Grey squares correspond to a model with the dust temperature computed with the parametrisation from (Hocuk et al. 2017) with Tdust = 6.6 K; cyan triangles correspond to a model with a fixed temperature of Tdust = 10.3 K, and red stars correspond to a dust temperature retrieved from Herschel data, with Tdust = 14 K.
Current usage metrics show cumulative count of Article Views (full-text article views including HTML views, PDF and ePub downloads, according to the available data) and Abstracts Views on Vision4Press platform.
Data correspond to usage on the plateform after 2015. The current usage metrics is available 48-96 hours after online publication and is updated daily on week days.
Initial download of the metrics may take a while.