Fig. 5
Download original image
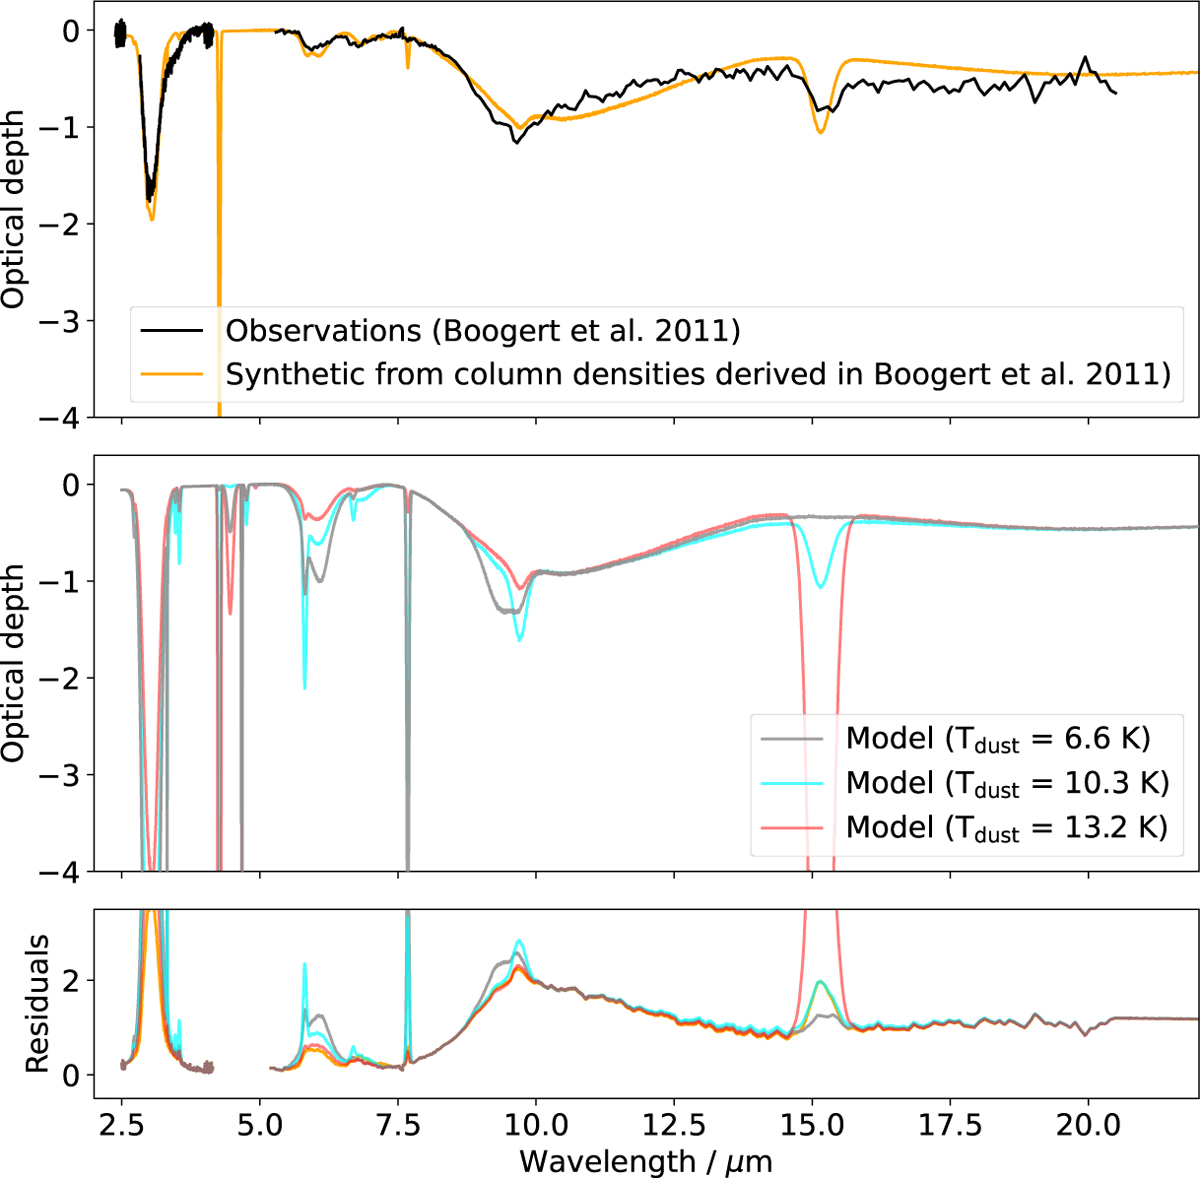
Top: optical depth derived from observation towards 2MASS J18170957-0814136 from Boogert et al. (2011) (black) and the synthetic optical-depth spectrum using the column densities derived from the latter (orange). Middle: synthetic optical depth from Nautilus predictions; the ‘cold’ model where the dust temperature (Tdust) was computed with the parametrisation from Hocuk et al. (2017) (Tdust = 6.6 K) is shown in grey; the ‘intermediate’ model (Tdust = 10.3 K) is shown in cyan; the ’warm’ model where Tdust was obtained from Herschel data (Tdust = 13.2 K) is shown in red. Bottom: absolute residuals from subtraction between observations and synthetic spectra presented above.
Current usage metrics show cumulative count of Article Views (full-text article views including HTML views, PDF and ePub downloads, according to the available data) and Abstracts Views on Vision4Press platform.
Data correspond to usage on the plateform after 2015. The current usage metrics is available 48-96 hours after online publication and is updated daily on week days.
Initial download of the metrics may take a while.