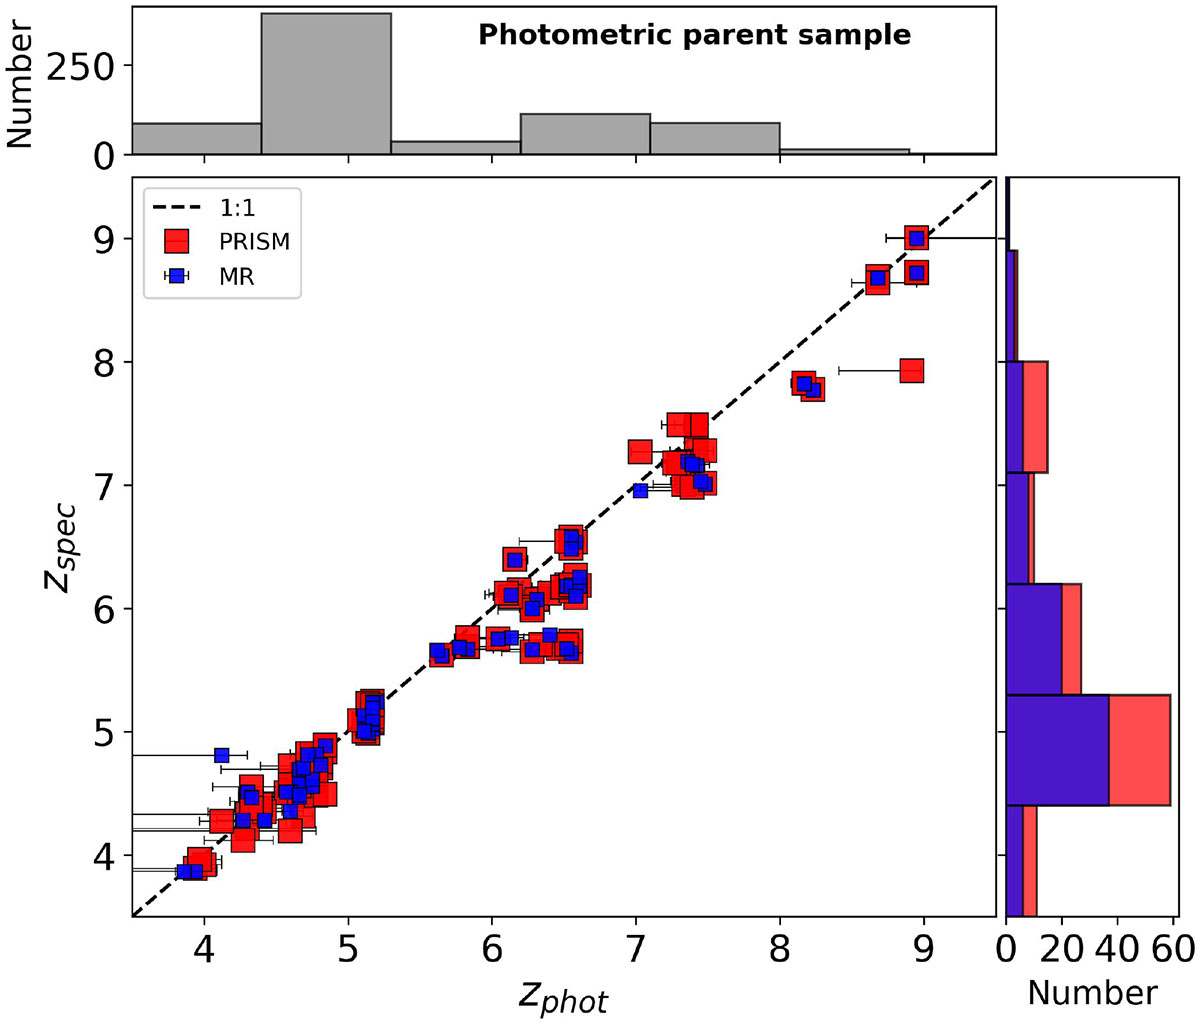
Fig. 1.
Download original image
Middle: comparison between zphot and zspec in the sample of selected EELGs. The dashed black line is the 1:1 relation. Right: distribution of zspec, shown as superimposed histograms. In both panels, in red (blue), the galaxies with PRISM (MR) spectra. Top: distribution of zphot in the photometric parent sample (Llerena et al. 2024).
Current usage metrics show cumulative count of Article Views (full-text article views including HTML views, PDF and ePub downloads, according to the available data) and Abstracts Views on Vision4Press platform.
Data correspond to usage on the plateform after 2015. The current usage metrics is available 48-96 hours after online publication and is updated daily on week days.
Initial download of the metrics may take a while.