Fig. 11.
Download original image
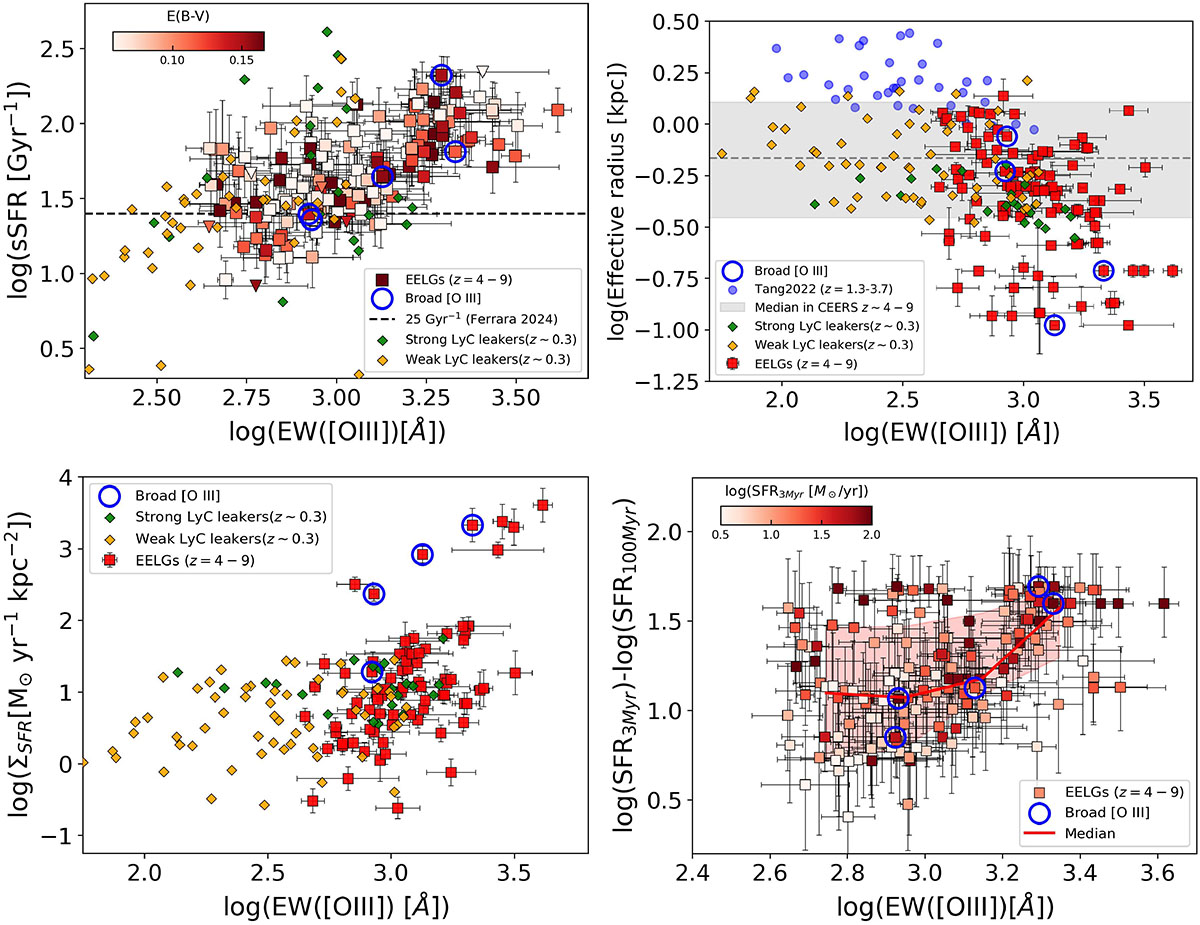
Relation between EW([O III]). Top left: sSFR. The symbols are colour-coded by E(B − V) from SED fitting. The triangle symbols are upper limits due to low Hβ S/N. The dashed line is the threshold for super-Eddington galaxies (Ferrara 2024). Top right: ropt. The blue circles are EELGs at intermediate-z (Tang et al. 2022). The horizontal dashed grey line is the median ropt in CEERS in the same redshift range. The shaded region indicates the 16th–84th percentile range. Bottom left: ΣSFR. Bottom right: SFR3 Myr/SFR100 Myr, as a proxy of the burstiness. The galaxies in the sample are colour-coded by the average SFR in the last 3Myr. The red line traces the median values of burstiness computed in bins of EW, while the shaded region is the 16th-and 84th percentiles. In all panels, green and orange symbols are as in Fig. 3. Open blue circles mark the position of EELGs identified in Sect. 5.2 with evidence of broad [O III], suggesting the presence of stellar outflows.
Current usage metrics show cumulative count of Article Views (full-text article views including HTML views, PDF and ePub downloads, according to the available data) and Abstracts Views on Vision4Press platform.
Data correspond to usage on the plateform after 2015. The current usage metrics is available 48-96 hours after online publication and is updated daily on week days.
Initial download of the metrics may take a while.