Fig. 12.
Download original image
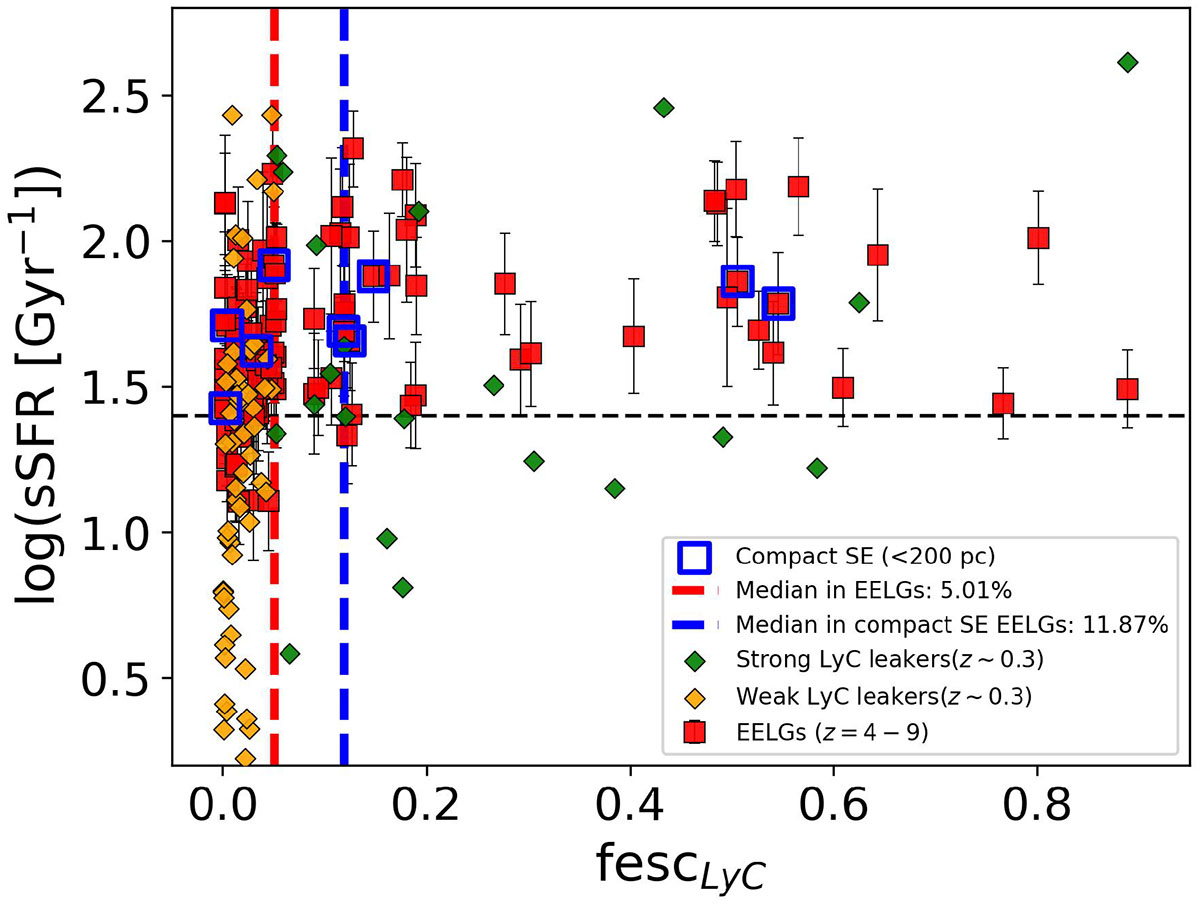
Inferred fescLyC vs. sSFR in the sample of EELGs (red squares). The horizontal dashed black line represents the 25 Gyr−1 threshold for SE regime. The blue open squares mark the position of galaxies with compact (< 200 pc) SE activity. The dashed red and blue vertical lines represent the median fescLyC for the entire sample and compact SE, respectively. The green and orange symbols are as in Fig. 3.
Current usage metrics show cumulative count of Article Views (full-text article views including HTML views, PDF and ePub downloads, according to the available data) and Abstracts Views on Vision4Press platform.
Data correspond to usage on the plateform after 2015. The current usage metrics is available 48-96 hours after online publication and is updated daily on week days.
Initial download of the metrics may take a while.