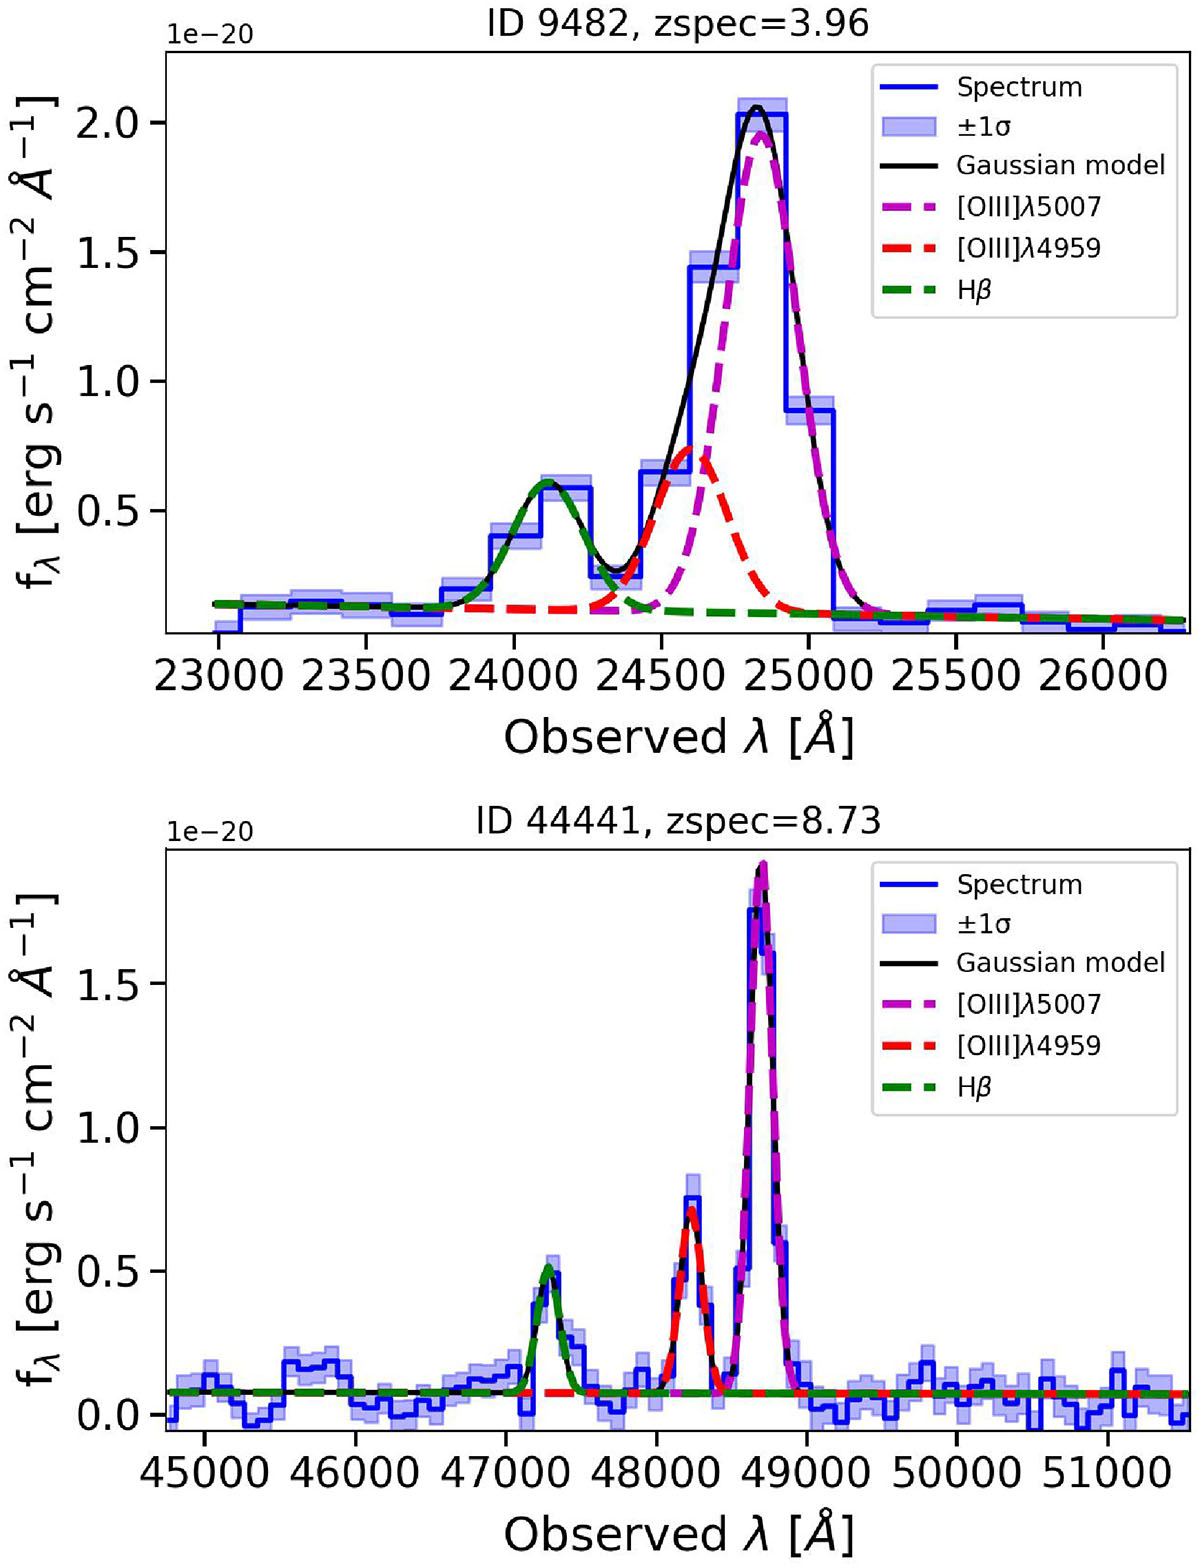
Fig. B.1.
Download original image
Showcases of Gaussian modelling of the [O III]+Hβ emission-line complex. Top: The lowest-redshift source in the CAPERS subsample, illustrating the case where the [O III]+Hβ lines are observed with a resolution R∼70. Bottom: The highest-redshift source in the CAPERS subsample, representing the opposite extreme where the [O III]+Hβ emission is observed with a resolution R∼270. In both panels, the observed NIRSpec/PRISM spectrum is shown as a blue solid line, with the shaded region indicating the 1σ uncertainty. The solid black curve represents the total best-fitting model to the [O III]+Hβ complex, while the magenta, red, and green dashed lines represent the individual Gaussian components of [O III]λ5007, [O III]λ4959, and Hβ, respectively.
Current usage metrics show cumulative count of Article Views (full-text article views including HTML views, PDF and ePub downloads, according to the available data) and Abstracts Views on Vision4Press platform.
Data correspond to usage on the plateform after 2015. The current usage metrics is available 48-96 hours after online publication and is updated daily on week days.
Initial download of the metrics may take a while.