Open Access
Fig. E.1.
Download original image
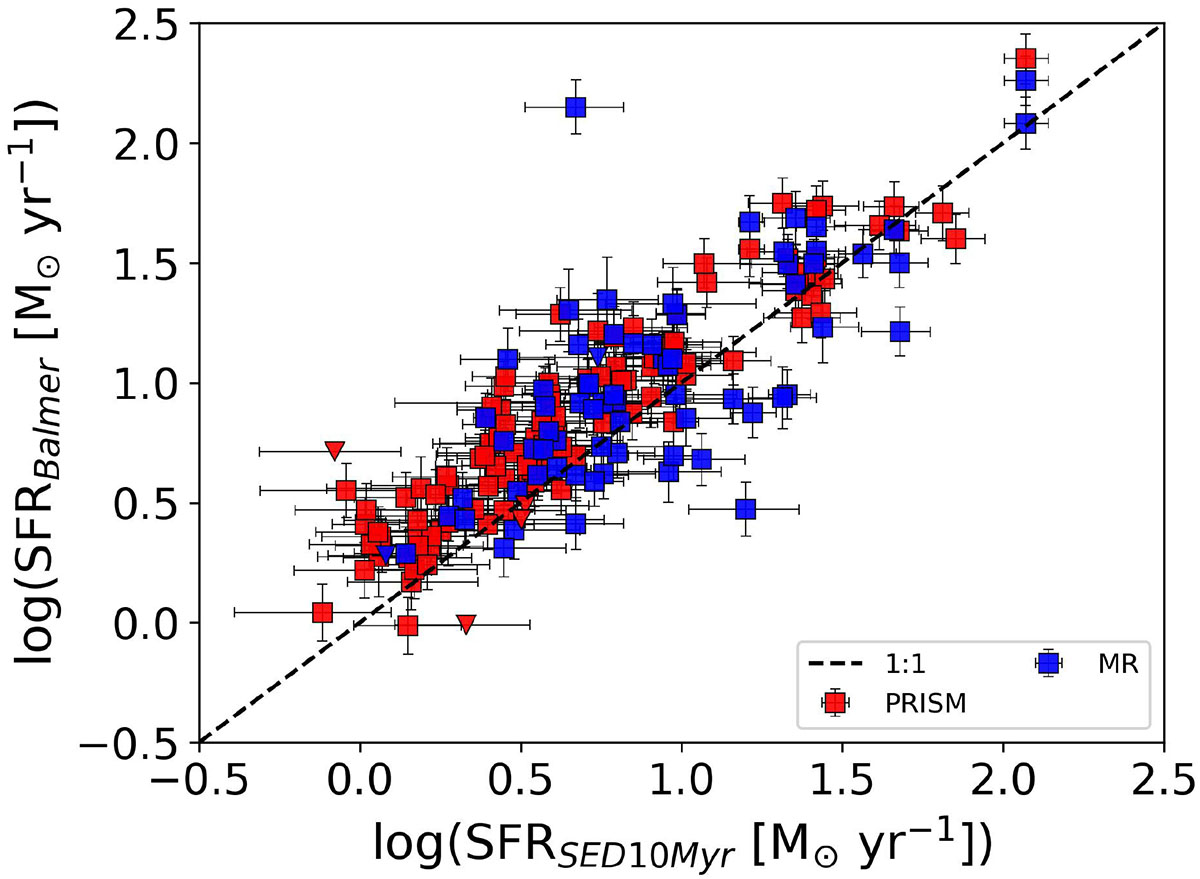
Comparison between SFRs from SED fitting (averaged over the last 10 Myr) and Balmer lines in the sample with PRISM (red squares) and MR (blue squares) spectra. Triangles indicate upper limits due to low Hβ S/N. The dashed black line shows the 1:1 relation.
Current usage metrics show cumulative count of Article Views (full-text article views including HTML views, PDF and ePub downloads, according to the available data) and Abstracts Views on Vision4Press platform.
Data correspond to usage on the plateform after 2015. The current usage metrics is available 48-96 hours after online publication and is updated daily on week days.
Initial download of the metrics may take a while.