Open Access
Fig. F.1.
Download original image
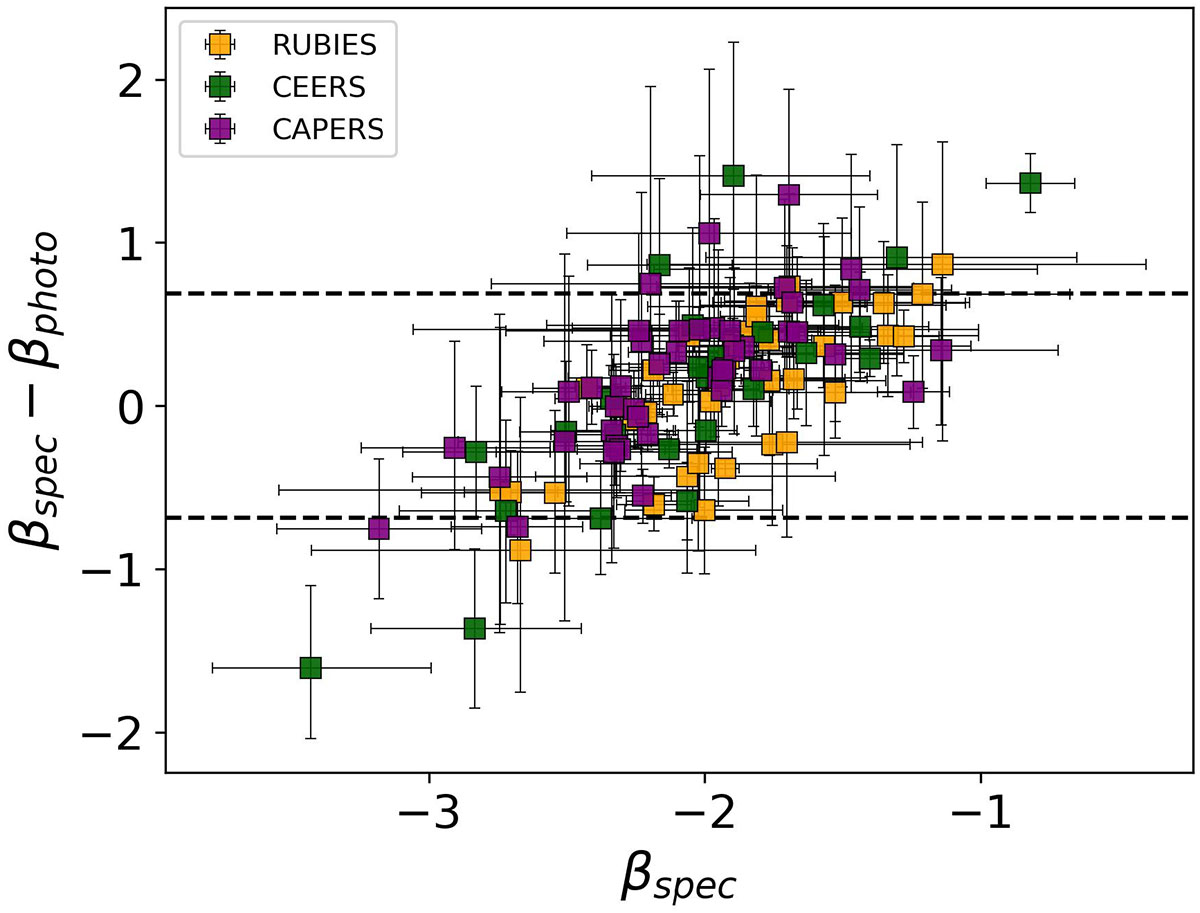
Difference in the UV β slopes estimated from spectra and photometry in the sample with PRISM spectra from the RUBIES (in orange), CEERS (in green) and CAPERS (in purple) surveys. The black dashed lines represent the median difference ± 1σ of the observed scatter.
Current usage metrics show cumulative count of Article Views (full-text article views including HTML views, PDF and ePub downloads, according to the available data) and Abstracts Views on Vision4Press platform.
Data correspond to usage on the plateform after 2015. The current usage metrics is available 48-96 hours after online publication and is updated daily on week days.
Initial download of the metrics may take a while.