Fig. 2.
Download original image
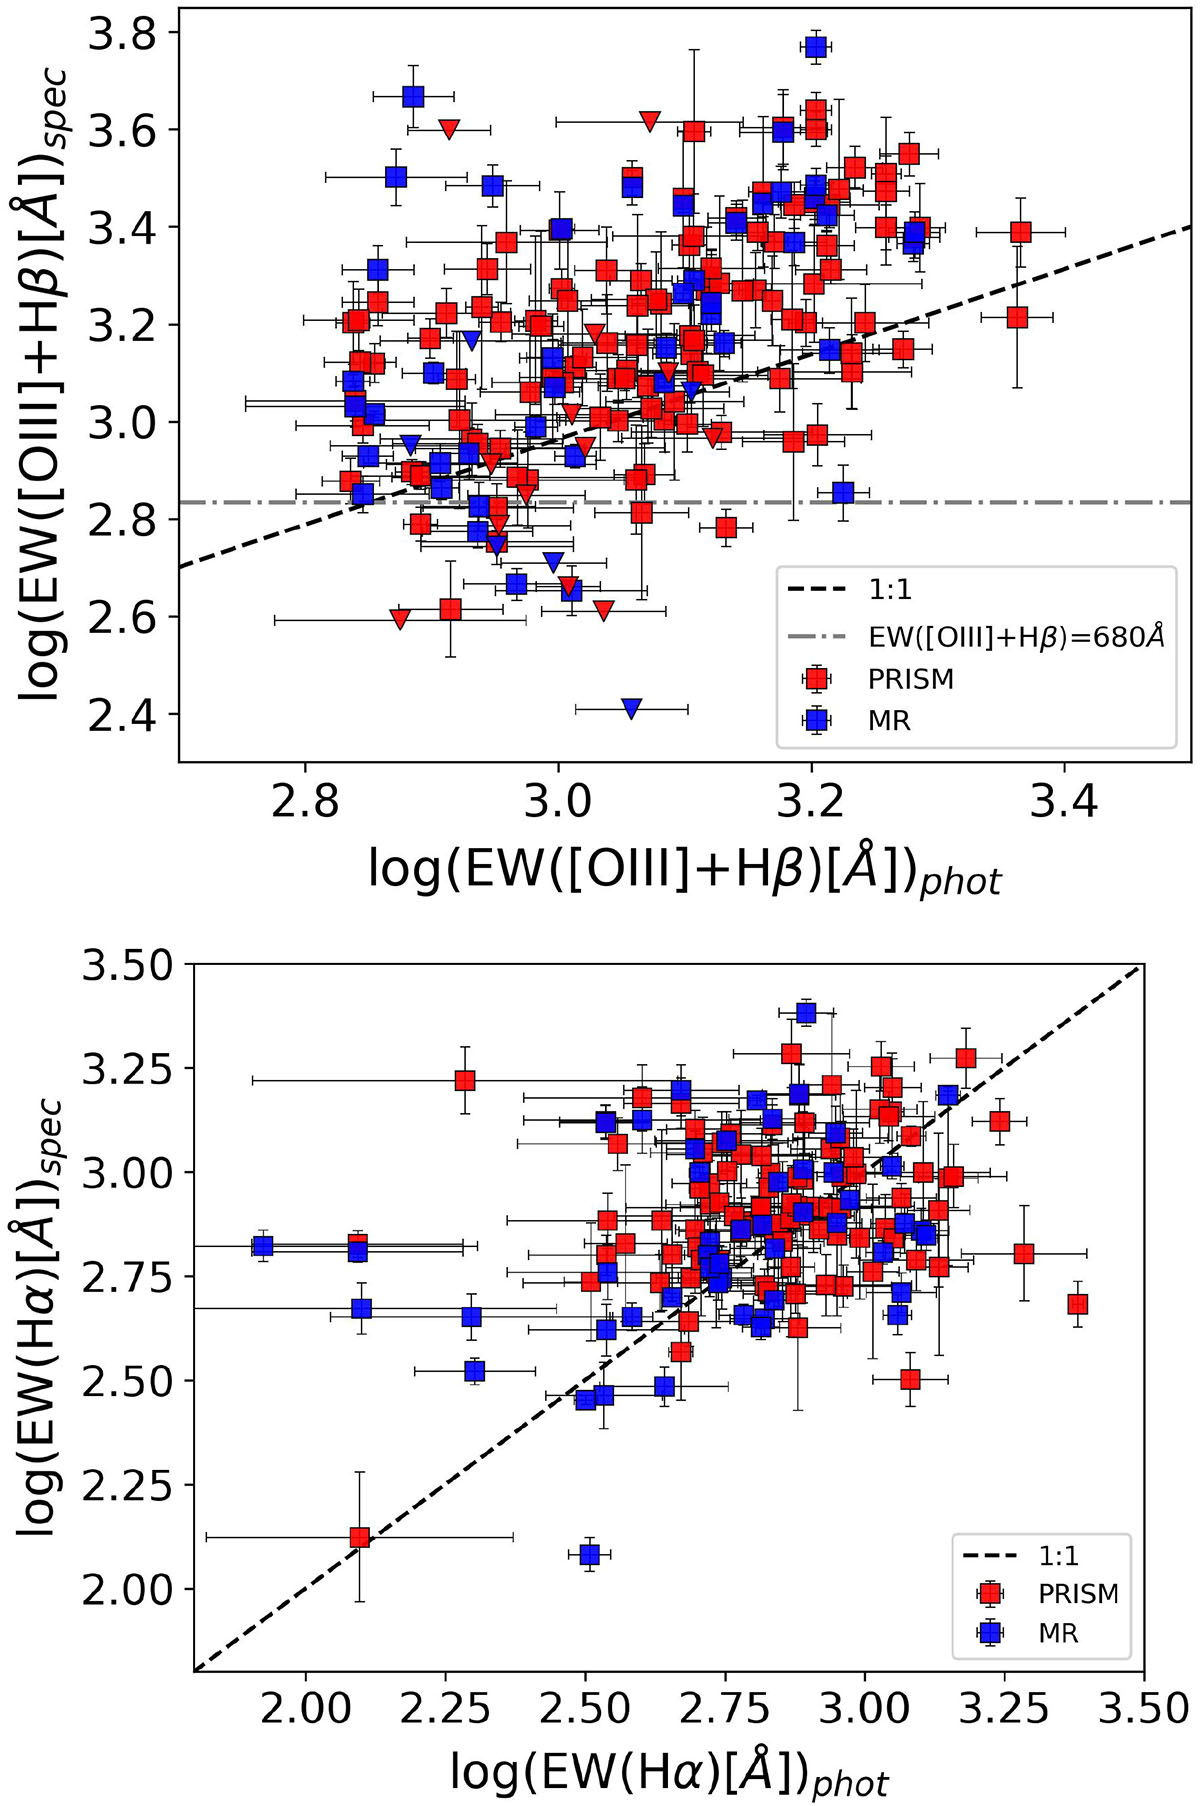
Comparison between EWs estimated from the photometry and from spectroscopy in the sample of EELGs with PRISM (red squares) or MR (blue squares) spectra. Top: EW([O III]+Hβ). The triangle symbols are upper limits due to low S/N of Hβ. The dotted-dashed grey line is the lower limit for the photometric selection. Bottom: EW(Hα). The dashed black line is the 1:1 relation.
Current usage metrics show cumulative count of Article Views (full-text article views including HTML views, PDF and ePub downloads, according to the available data) and Abstracts Views on Vision4Press platform.
Data correspond to usage on the plateform after 2015. The current usage metrics is available 48-96 hours after online publication and is updated daily on week days.
Initial download of the metrics may take a while.