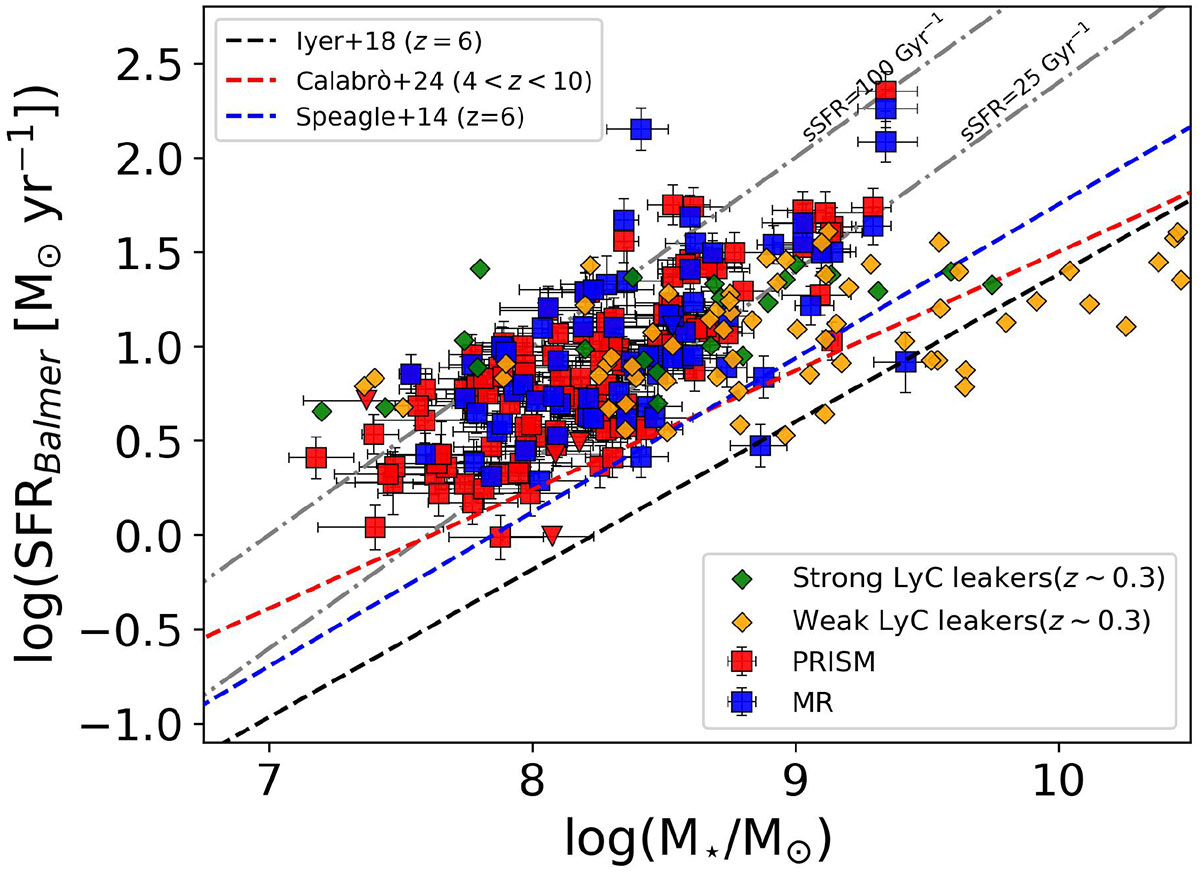
Fig. 3.
Download original image
Distribution of the sample in the M★–SFR plane. The red and blue squares represent the EELGs with PRISM and MR spectra, respectively. The triangle symbols are upper limits due to low Hβ S/N. The dashed black and blue lines are the main sequence of SF galaxies at z = 6 from Iyer et al. (2018) and Speagle et al. (2014), respectively, while the dashed red line represents the main sequence at 4 < z < 10 from Calabrò et al. (2024b). The green (orange) diamonds are the sample of strong (weak) LyC leakers at z ∼ 0.3 (Flury et al. 2022a; Jaskot et al. 2024a,b). The dashed-dotted lines represent constant sSFR lines.
Current usage metrics show cumulative count of Article Views (full-text article views including HTML views, PDF and ePub downloads, according to the available data) and Abstracts Views on Vision4Press platform.
Data correspond to usage on the plateform after 2015. The current usage metrics is available 48-96 hours after online publication and is updated daily on week days.
Initial download of the metrics may take a while.