Open Access
Fig. 5.
Download original image
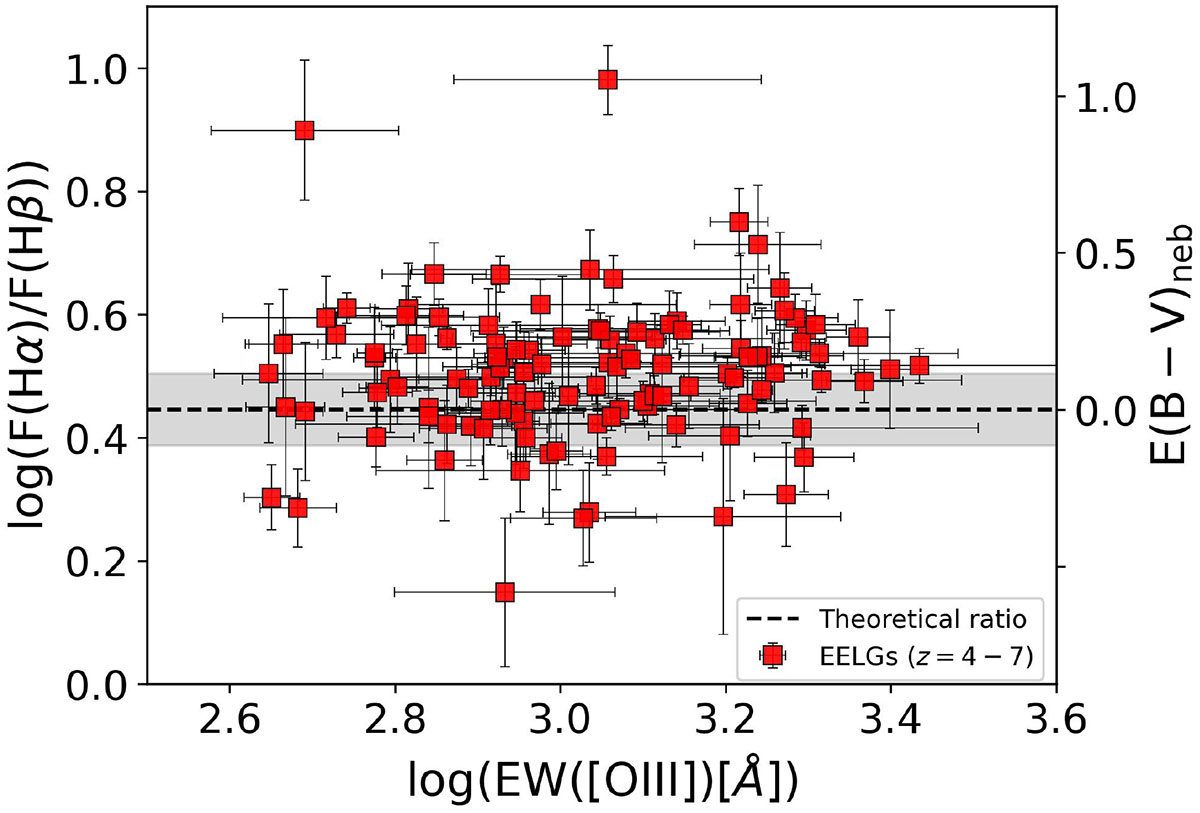
Relation between Hα/Hβ ratio and EW([O III]) for the sample of EELGs (red squares). In the right y-axis, we show the corresponding E(B − V)neb. The grey shaded region corresponds to the mean error ∼0.06 dex in the Hα/Hβ ratio.
Current usage metrics show cumulative count of Article Views (full-text article views including HTML views, PDF and ePub downloads, according to the available data) and Abstracts Views on Vision4Press platform.
Data correspond to usage on the plateform after 2015. The current usage metrics is available 48-96 hours after online publication and is updated daily on week days.
Initial download of the metrics may take a while.