Fig. 1
Download original image
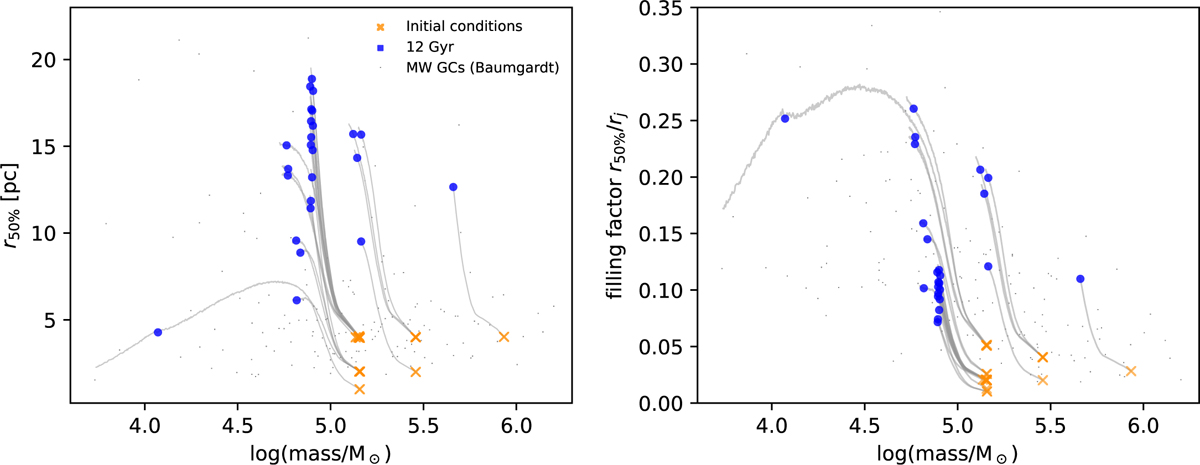
Time evolution of the mass; half-light radius, r50%; and filling factor, r50%/rj, of our set of simulations. Orange crosses are the initial conditions, blue dots are the snapshots at 12 Gyr, and the gray lines indicate the time evolution. The comparison with MW GCs (gray dots, Baumgardt GCs Database) highlights that our simulated GCs cover the current parameter space of real GCs in the low-density regime.
Current usage metrics show cumulative count of Article Views (full-text article views including HTML views, PDF and ePub downloads, according to the available data) and Abstracts Views on Vision4Press platform.
Data correspond to usage on the plateform after 2015. The current usage metrics is available 48-96 hours after online publication and is updated daily on week days.
Initial download of the metrics may take a while.