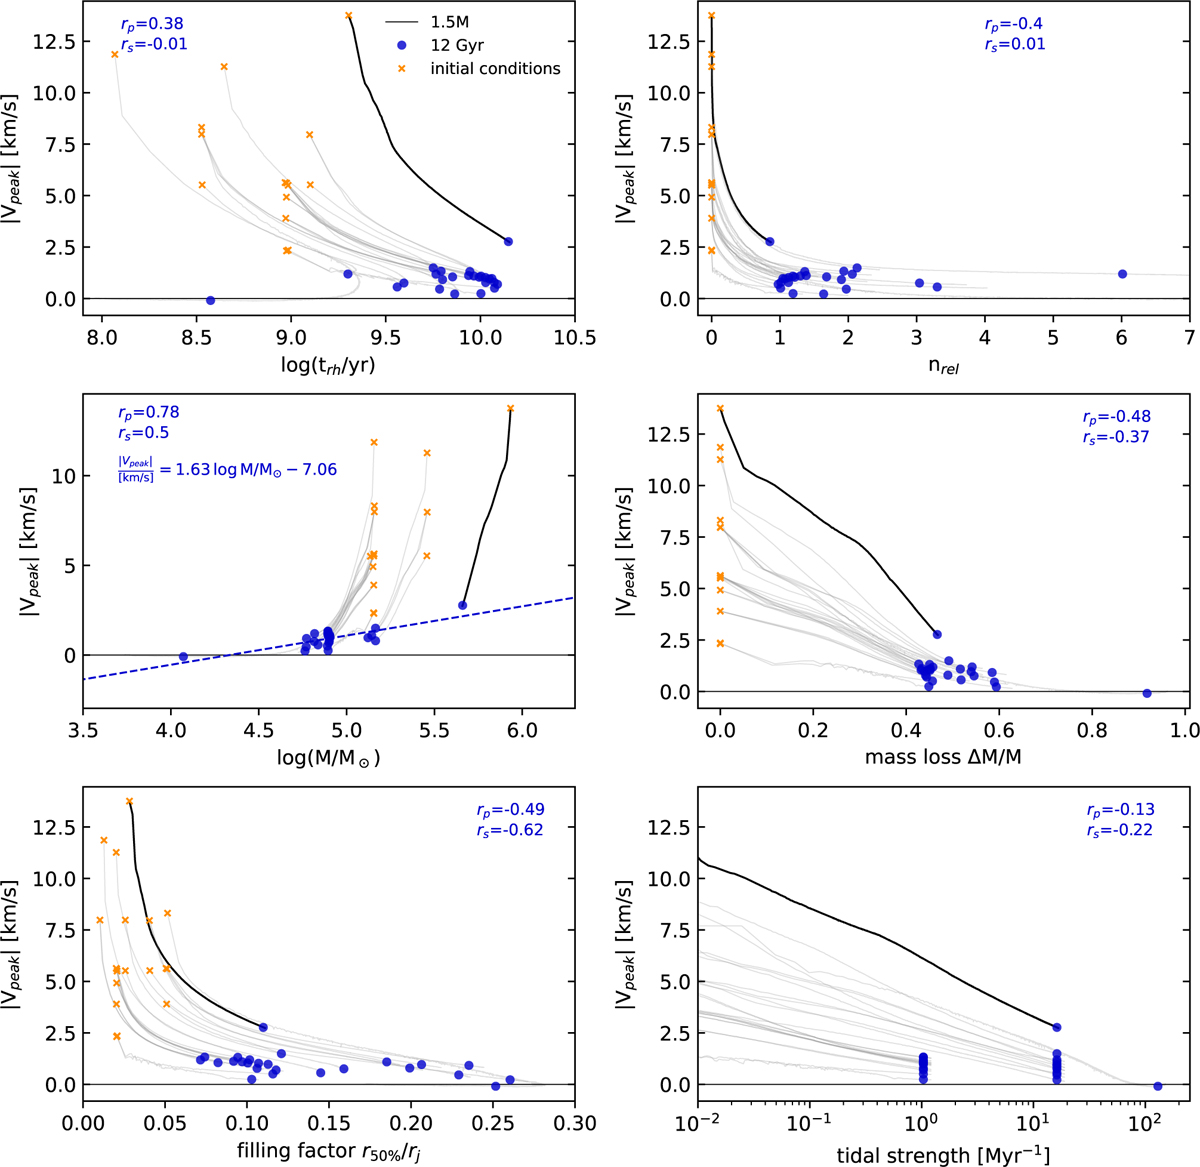
Fig. 10
Download original image
Correlation between the peak of the velocity profiles |Vpeak| of all simulations versus various quantities: the relaxation time trh at a given snapshot; the number of relaxation times nrel; the total mass M; the mass loss ∆M/M; the tidal filling factor r50%/rt; and the cumulative tidal strength experienced by a cluster (defined in Sect. 3.4). Orange crosses indicate the initial conditions, blue circles the snapshots at 12 Gyr, and the gray lines the evolutionary tracks. We highlight in black the track corresponding to the simulation 1.5M-A-R4-10. For each panel we performed a Pearson and a Spearman correlation test for the data points at 12 Gyr, and we indicate the corresponding coefficients (rp and rs), and plot the corresponding linear fit (dotted blue line) for the panel showing the strongest correlation, |Vpeak| vs. M.
Current usage metrics show cumulative count of Article Views (full-text article views including HTML views, PDF and ePub downloads, according to the available data) and Abstracts Views on Vision4Press platform.
Data correspond to usage on the plateform after 2015. The current usage metrics is available 48-96 hours after online publication and is updated daily on week days.
Initial download of the metrics may take a while.