Fig. 12
Download original image
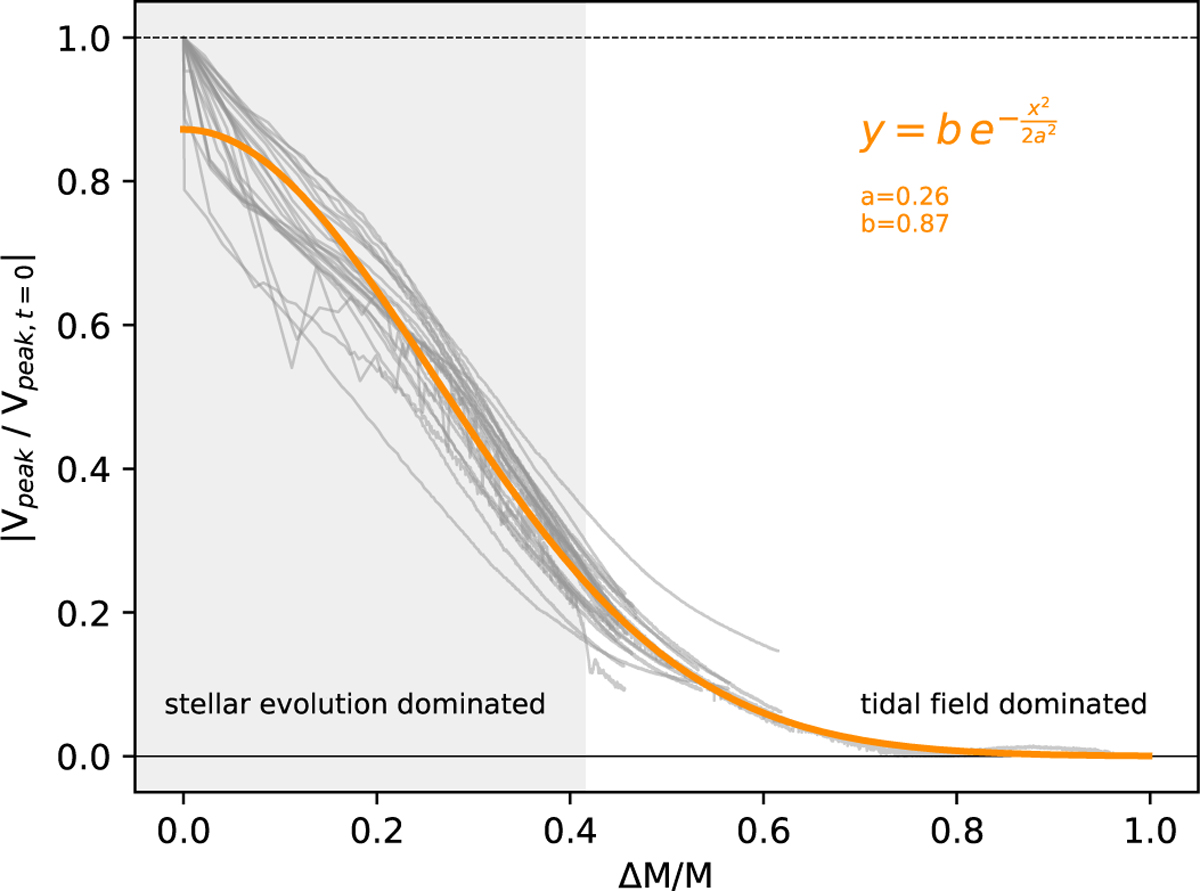
Evolution of the absolute value of the rotation peak Vpeak normalized by the initial value at time t=0, Vpeak,t=0 as a function of mass loss ∆M/M. All simulations follow a similar track with a small variation, indicating that mass loss is the key parameter driving the decrease of rotation strength. The orange line is a fit of a simple function able to reproduce the shape of this evolutionary track. By measuring Vpeak and mass loss at the present time, one can estimate the initial rotation peak (and the rotation peak at any given time). The gray shaded area indicates the phases where mass loss is dominated by stellar evolution or by tidal stripping (see also Fig. 9).
Current usage metrics show cumulative count of Article Views (full-text article views including HTML views, PDF and ePub downloads, according to the available data) and Abstracts Views on Vision4Press platform.
Data correspond to usage on the plateform after 2015. The current usage metrics is available 48-96 hours after online publication and is updated daily on week days.
Initial download of the metrics may take a while.