Fig. 13
Download original image
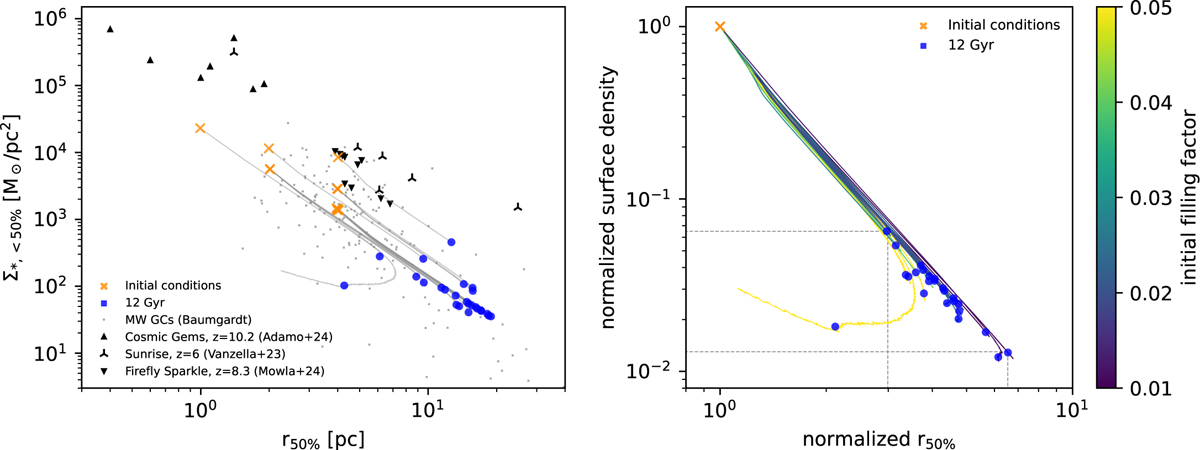
Left panel: evolution of the surface density calculated within the half-mass radius, Σ∗,<50%, as a function of the half-mass radius compared to observation of the present-day MW GCs (gray dots) and high-redshift observations of proto-GCs (black symbols). Orange crosses and blue dots indicate the initial and 12 Gyr snapshots of the simulations. Right panel: normalized version of the left panel where each simulation is color coded according to its initial tidal filling factor. This plot shows that in this parameter space, GCs follow a similar track: after 12 Gyr of evolution, the surface density decreases by a factor of ≈1–6 × 10⁻², and the half-mass radius increases by a factor of ≈3–5.
Current usage metrics show cumulative count of Article Views (full-text article views including HTML views, PDF and ePub downloads, according to the available data) and Abstracts Views on Vision4Press platform.
Data correspond to usage on the plateform after 2015. The current usage metrics is available 48-96 hours after online publication and is updated daily on week days.
Initial download of the metrics may take a while.