Fig. 14
Download original image
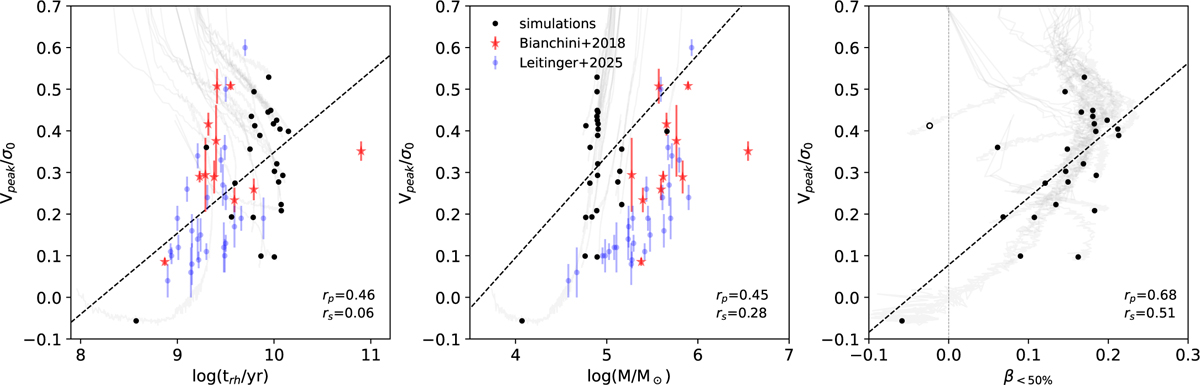
Comparison of our simulations (at 12 Gyr, black circles) with recent observations (Bianchini et al. 2018a; Leitinger et al. 2025). From left to right: Vpeak/σ0 vs. relaxation time at the half-mass radius, total mass, and anisotropy within the half-mass radius. The dotted lines are the linear fits to the simulation data, for which the Pearson and Spearman correlation coefficient are indicated in the bottom right. The strongest correlation was obtained for Vpeak/σ0 vs. β<50%, for which data are not available. In this panel, we also note that the simulation 250k-A-R4-10-retr, characterized by retrograde rotation and strong tidal field, is a clear outlier (empty circle).
Current usage metrics show cumulative count of Article Views (full-text article views including HTML views, PDF and ePub downloads, according to the available data) and Abstracts Views on Vision4Press platform.
Data correspond to usage on the plateform after 2015. The current usage metrics is available 48-96 hours after online publication and is updated daily on week days.
Initial download of the metrics may take a while.