Fig. 4
Download original image
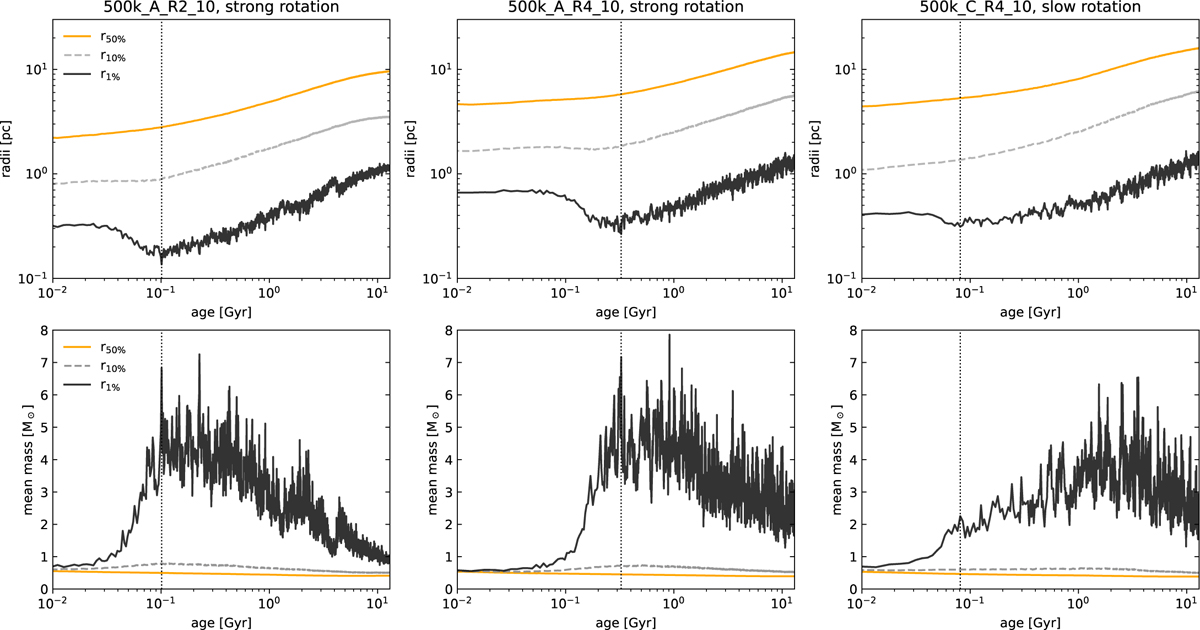
Top row: evolution of 50%, 10%, and 1% Lagrangian radii (orange, gray, and black lines) for simulations 500k-A-R2-10, 500k-A-R4-10, and 500k-C-R4-10. The three simulations are representative of different densities and rotation strengths. The vertical lines indicate the time of core collapse. Higher density GCs show an earlier and deeper collapse, whereas low rotating GCs show a weaker signature of collapse. Bottom row: evolution of the mean mass within the same Lagrangian radii of the top panel. The 1% Lagrangian radii mainly contain massive objects, corresponding to BHs (or their progenitors). High-density and strong rotating GCs mass segregate more efficiently, in timescales of a few hundred million years.
Current usage metrics show cumulative count of Article Views (full-text article views including HTML views, PDF and ePub downloads, according to the available data) and Abstracts Views on Vision4Press platform.
Data correspond to usage on the plateform after 2015. The current usage metrics is available 48-96 hours after online publication and is updated daily on week days.
Initial download of the metrics may take a while.