Fig. 5
Download original image
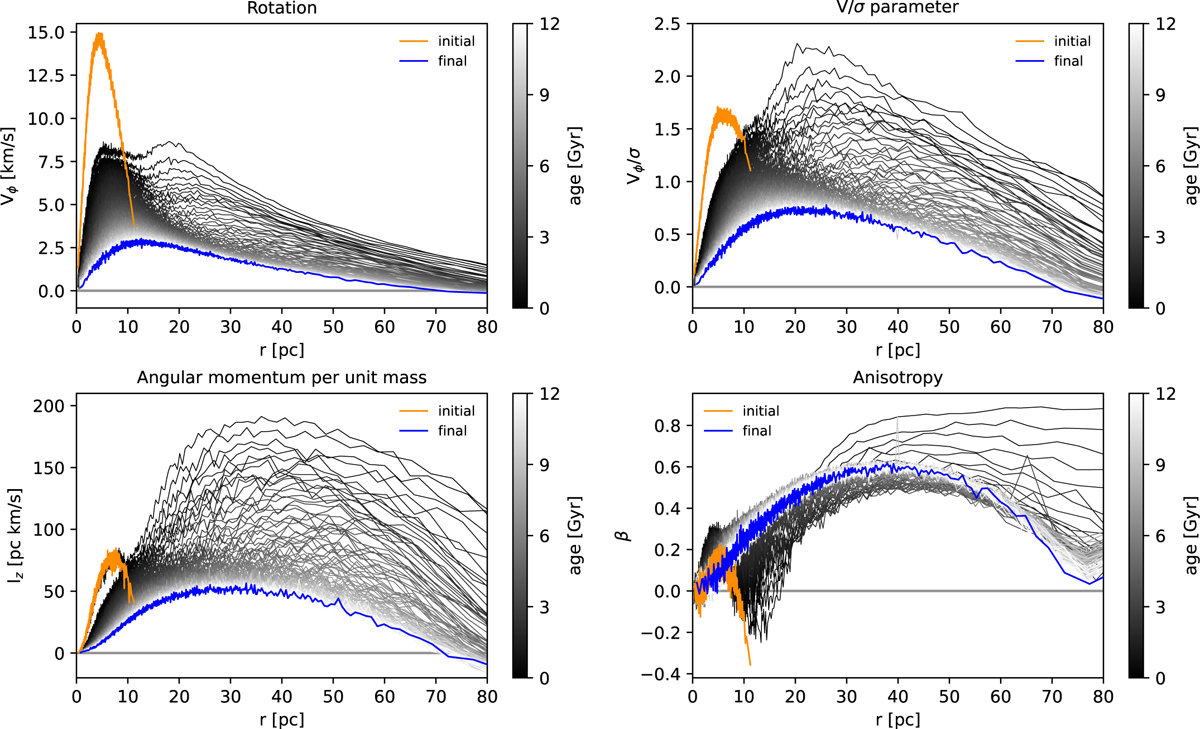
Evolution of the kinematic profiles of the 1.5M-A-R4-10 simulation from time t=0 Gyr (orange lines) to t=12 Gyr (blue lines). The intermediate time snapshots are color coded in gray scale. The panels report the rotation profile Vϕ(r), the Vϕ/σ(r) profile indicating the ratio between ordered and random motion, the z-component of the angular momentum per unit mass lz(r), and the anisotropy profile β(r). The time resolution between the plotted lines is ≈64 Myr.
Current usage metrics show cumulative count of Article Views (full-text article views including HTML views, PDF and ePub downloads, according to the available data) and Abstracts Views on Vision4Press platform.
Data correspond to usage on the plateform after 2015. The current usage metrics is available 48-96 hours after online publication and is updated daily on week days.
Initial download of the metrics may take a while.