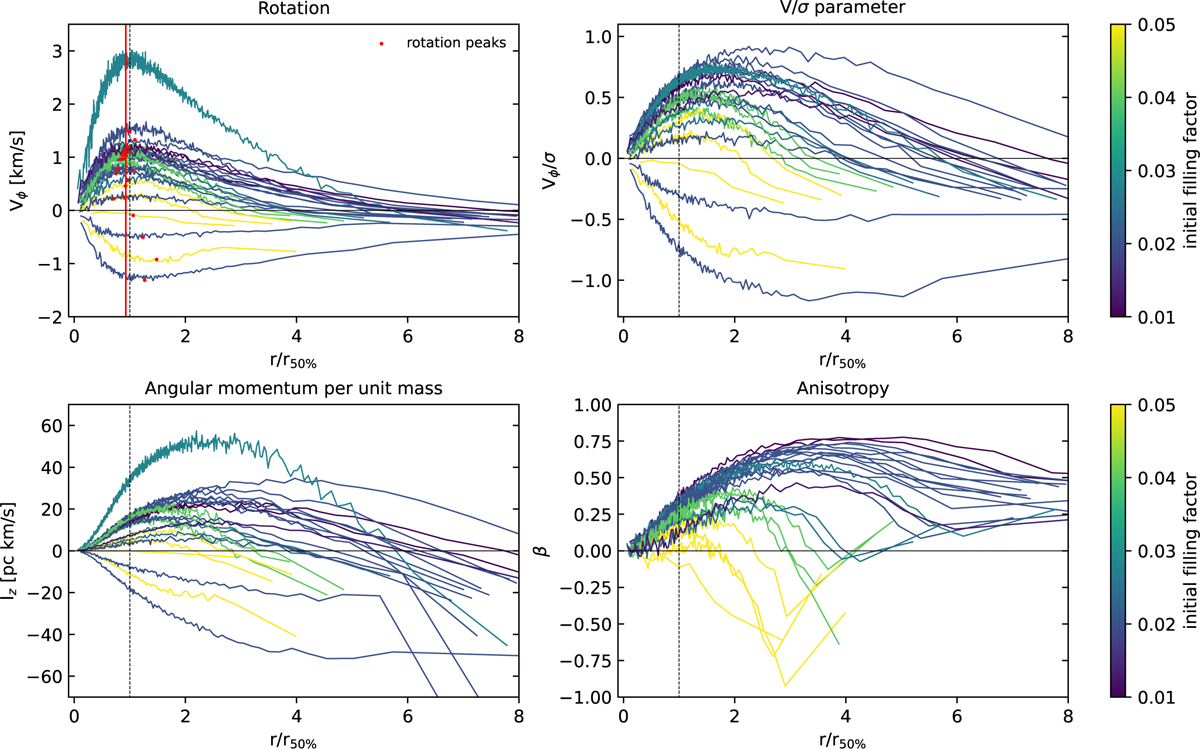
Fig. 6
Download original image
Kinematic profiles, as in Fig. 5, for the entire set of simulations at 12 Gyr. The profiles have been normalized by the respective half-mass radii r50% (vertical dashed lines) and are color coded by the value of their initial tidal filling factor (r50%/rj) tracing the tidal influence on a GC. In the rotation profile, Vϕ(r), we indicate the rotation peaks with red dots and their average radial position with a vertical red line.
Current usage metrics show cumulative count of Article Views (full-text article views including HTML views, PDF and ePub downloads, according to the available data) and Abstracts Views on Vision4Press platform.
Data correspond to usage on the plateform after 2015. The current usage metrics is available 48-96 hours after online publication and is updated daily on week days.
Initial download of the metrics may take a while.