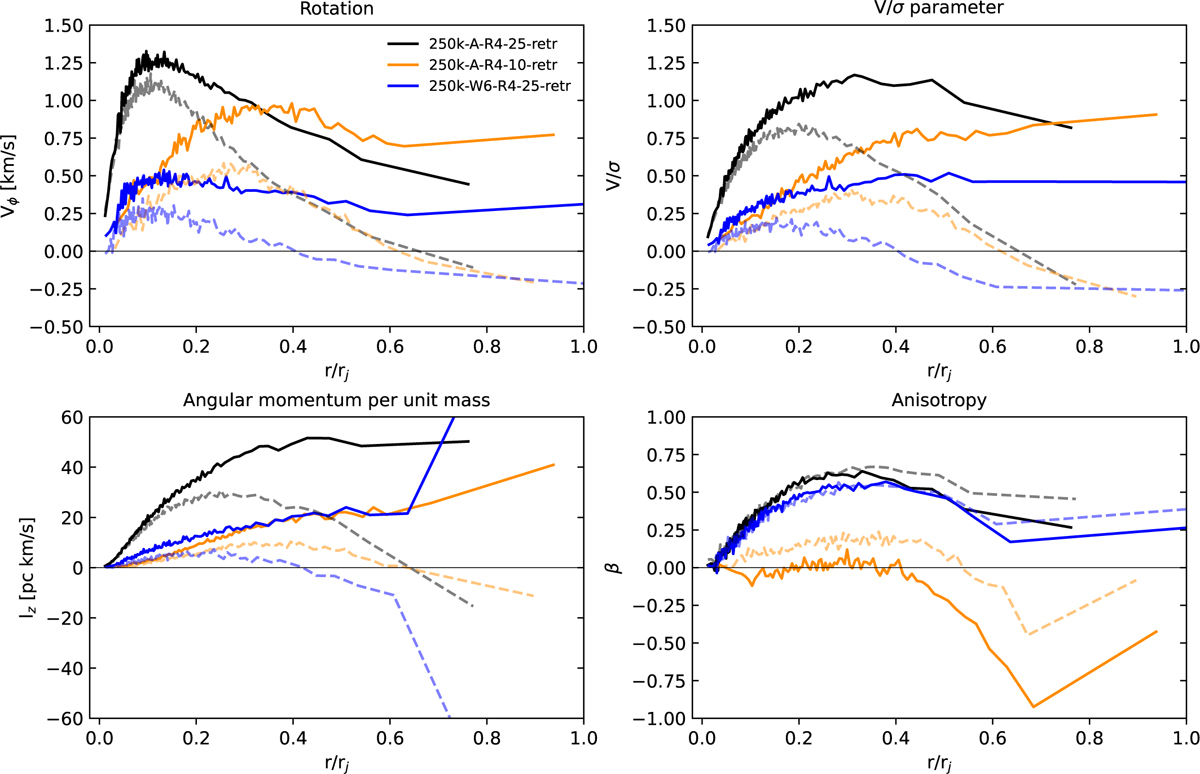
Fig. 7
Download original image
Kinematic profiles at 12 Gyr of three simulations with prograde rotation (with respect to the orbital angular momentum) compared to their retrograde counterparts. For the retrograde profiles, we plot the absolute values. Each profile has been normalized by its corresponding Jacobi radius, rj. Retrograde GCs are indicated as solid lines, while prograde ones are shown as dotted lines. Although prograde and retrograde simulations pairs have identical initial structures and rotation strengths, they significantly differ after 12 Gyr of evolution due to the complex coupling of internal rotation and the tidal field. Retrograde GCs retain a higher amount of angular momentum and show significant differences in rotation both in their outskirts and in the intermediate regions (∼0.5 rj).
Current usage metrics show cumulative count of Article Views (full-text article views including HTML views, PDF and ePub downloads, according to the available data) and Abstracts Views on Vision4Press platform.
Data correspond to usage on the plateform after 2015. The current usage metrics is available 48-96 hours after online publication and is updated daily on week days.
Initial download of the metrics may take a while.