Fig. 9
Download original image
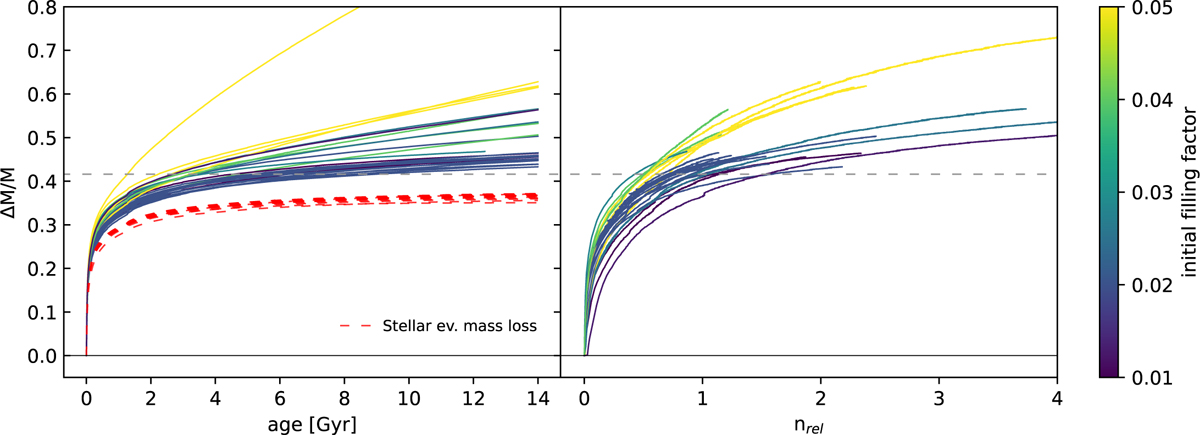
Left panel: globular cluster mass loss ∆M/M vs. age. Right panel: globular cluster mass loss ∆M/M vs. number of relaxation times experienced by the GC, nrel = age/trh. Each GC curve is color coded according to the initial tidal filling factor. The red lines indicate the mass loss due to stellar evolution alone, common for all simulations and dominating in the first gigayear of evolution. The horizontal dashed line indicates the point where the mass loss starts to be dominated by tidal effects (stellar escapers) rather than stellar evolution processes. The plot shows the importance of the initial filling condition in defining the amount of mass loss cumulatively experienced by a GC after 12 Gyr of evolution. The nrel plot clearly shows that GCs formed with initial filling factors higher than 0.035 lose significantly more mass given the same relaxation condition.
Current usage metrics show cumulative count of Article Views (full-text article views including HTML views, PDF and ePub downloads, according to the available data) and Abstracts Views on Vision4Press platform.
Data correspond to usage on the plateform after 2015. The current usage metrics is available 48-96 hours after online publication and is updated daily on week days.
Initial download of the metrics may take a while.