Fig. D.1
Download original image
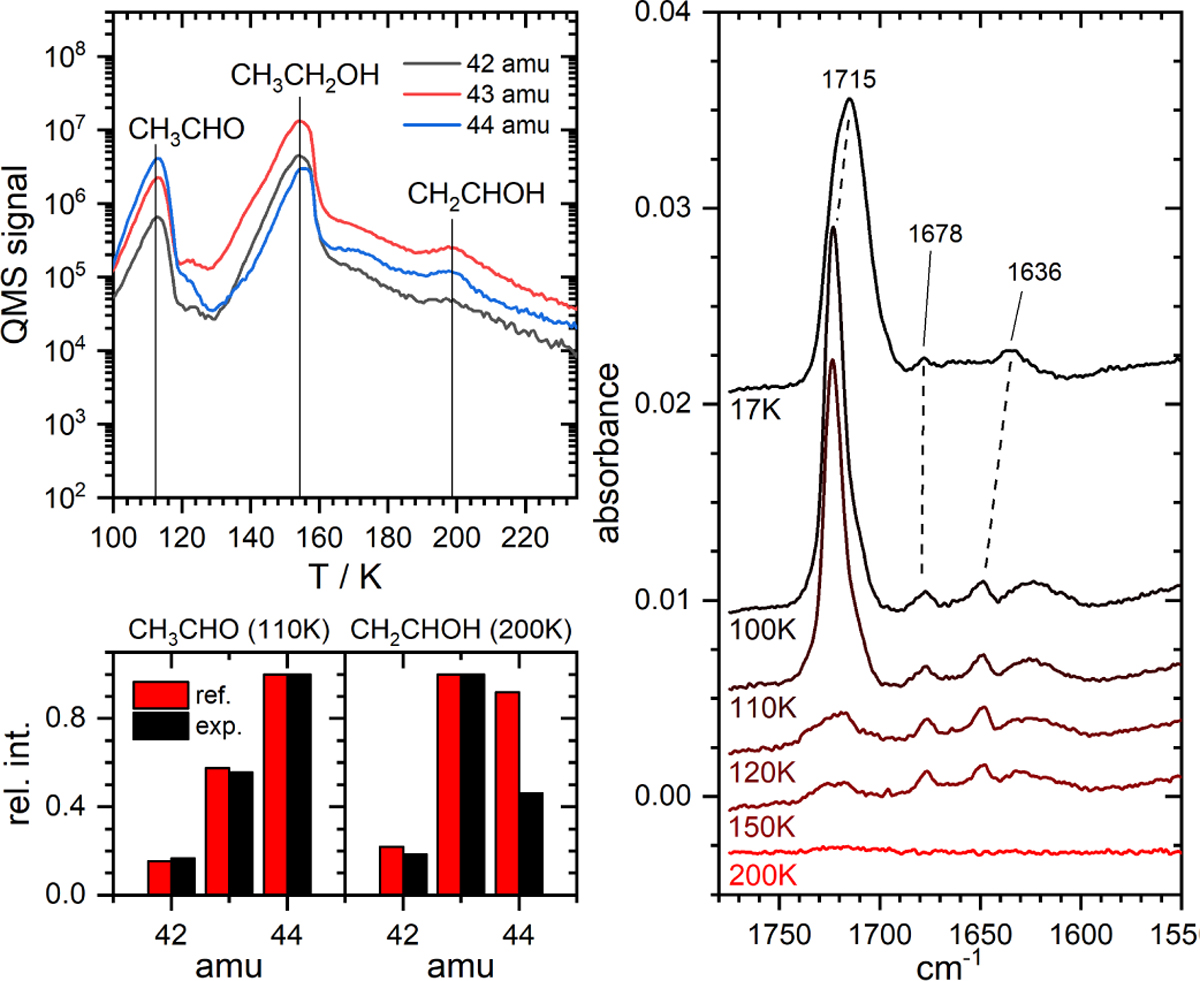
TPD signatures of hydrogen loss from ethanol in experiment N. On the left, relevant mass channels for acetaldehyde and vinyl alcohol are shown and compared to reference mass spectra obtained from Chuang et al. (2020). On the right, RAIR spectra are shown at several temperatures, indicating the changes in peak intensity. Note that the peak positions 1715 and 1678 / 1636 cm−1 correspond to CH3CHO and CH2CHOH respectively.
Current usage metrics show cumulative count of Article Views (full-text article views including HTML views, PDF and ePub downloads, according to the available data) and Abstracts Views on Vision4Press platform.
Data correspond to usage on the plateform after 2015. The current usage metrics is available 48-96 hours after online publication and is updated daily on week days.
Initial download of the metrics may take a while.