Open Access
Fig. D.3
Download original image
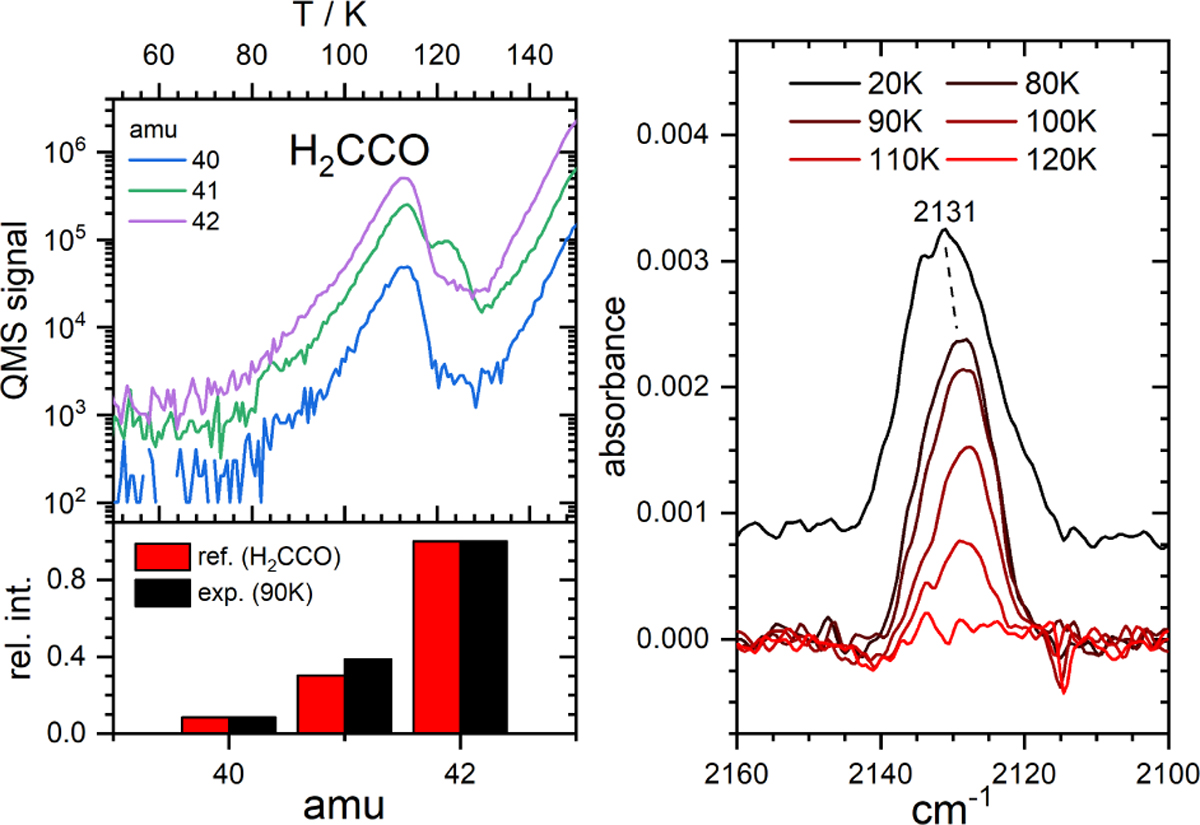
TPD signatures of ketene formation in experiment G. On the left, relevant mass channels are shown and compared to the reference mass spectrum in the NIST database. On the right, RAIR spectra are shown at several temperatures, indicating the changes in peak intensity.
Current usage metrics show cumulative count of Article Views (full-text article views including HTML views, PDF and ePub downloads, according to the available data) and Abstracts Views on Vision4Press platform.
Data correspond to usage on the plateform after 2015. The current usage metrics is available 48-96 hours after online publication and is updated daily on week days.
Initial download of the metrics may take a while.