Open Access
Fig. D.4
Download original image
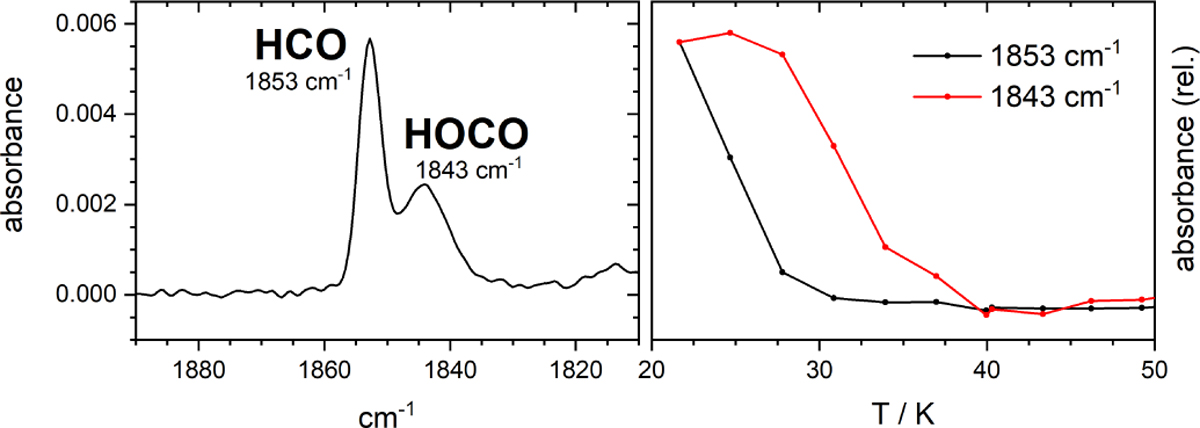
(left) Absorption features in sample E assigned to the HOCO• and HCO• radicals. (right) Desorption behavior of the peaks shown in the left panel, where we have plotted the absorbance at the indicated frequency. The data are normalized to the initial value to more clearly depict the temperature dependence.
Current usage metrics show cumulative count of Article Views (full-text article views including HTML views, PDF and ePub downloads, according to the available data) and Abstracts Views on Vision4Press platform.
Data correspond to usage on the plateform after 2015. The current usage metrics is available 48-96 hours after online publication and is updated daily on week days.
Initial download of the metrics may take a while.